Create events on data#
Overview#
Roboto provides comprehensive support for creating events on your log data. An event enables you to link key entities, such as datasets, files, topics, and message paths, to a specific timespan.
Events are a powerful way to mark important moments of interest (e.g., Crash, Left Turn, or Takeoff) and correlate them with the underlying data.
In this guide, we’ll walk you through how to create events and retrieve them using the SDK. You can also create events automatically by processing files with custom actions (see example).
Prerequisites#
Ensure you have a Roboto Account.
Set up Programmatic Access with the Roboto SDK (optional)
Install the extra SDK analytics module:
pip install roboto[analytics](optional)
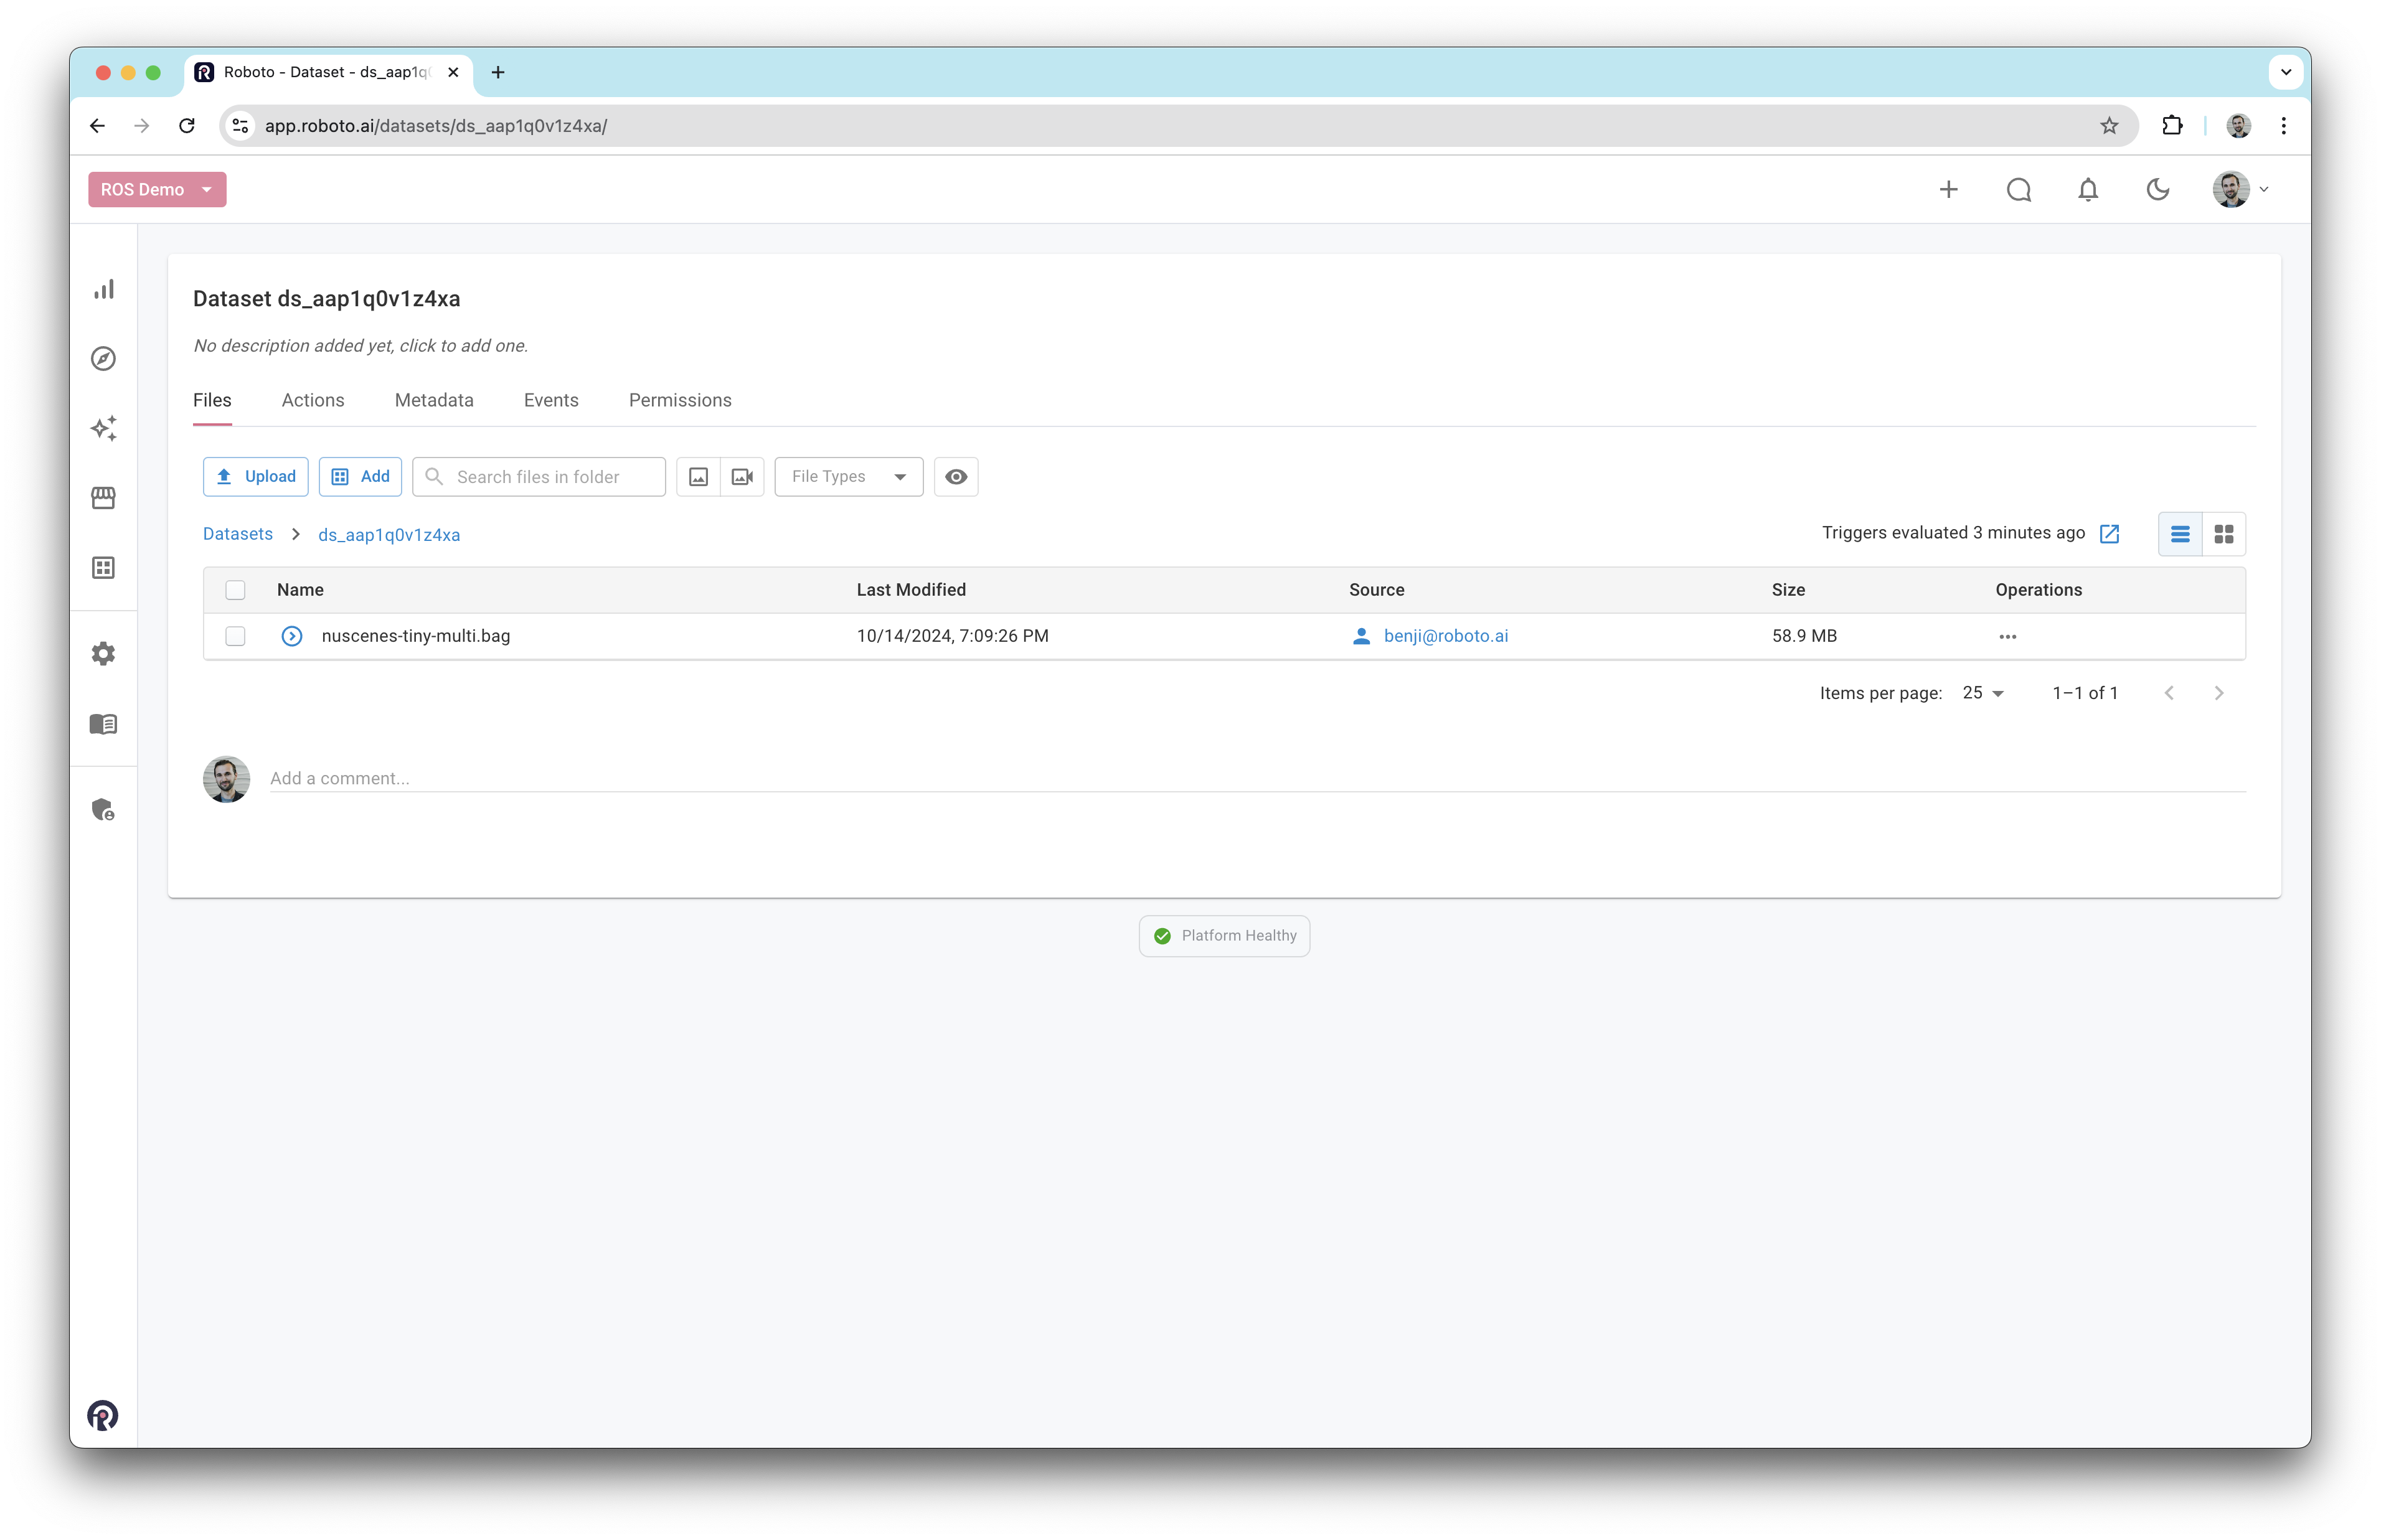
Create a dataset#
Create a new dataset using the + icon in the top navigation bar.
Once created, download this sample log (nuscenes-tiny-multi.bag) and upload it to your Roboto dataset. This is a ROS bag file, but you can use other ingestable log formats too, such as a PX4 ULog.
Wait for file to be ingested#
After uploading a log, Roboto will automatically trigger the ingestion process. A blue spinner next to the Actions tab indicates that ingestion is in progress. This may take a few seconds to appear if Roboto is under heavy load.
If you don’t see the spinner appear, you may not have a ROS ingestion trigger configured in your account. Follow the steps at ROS Triggers to add one.
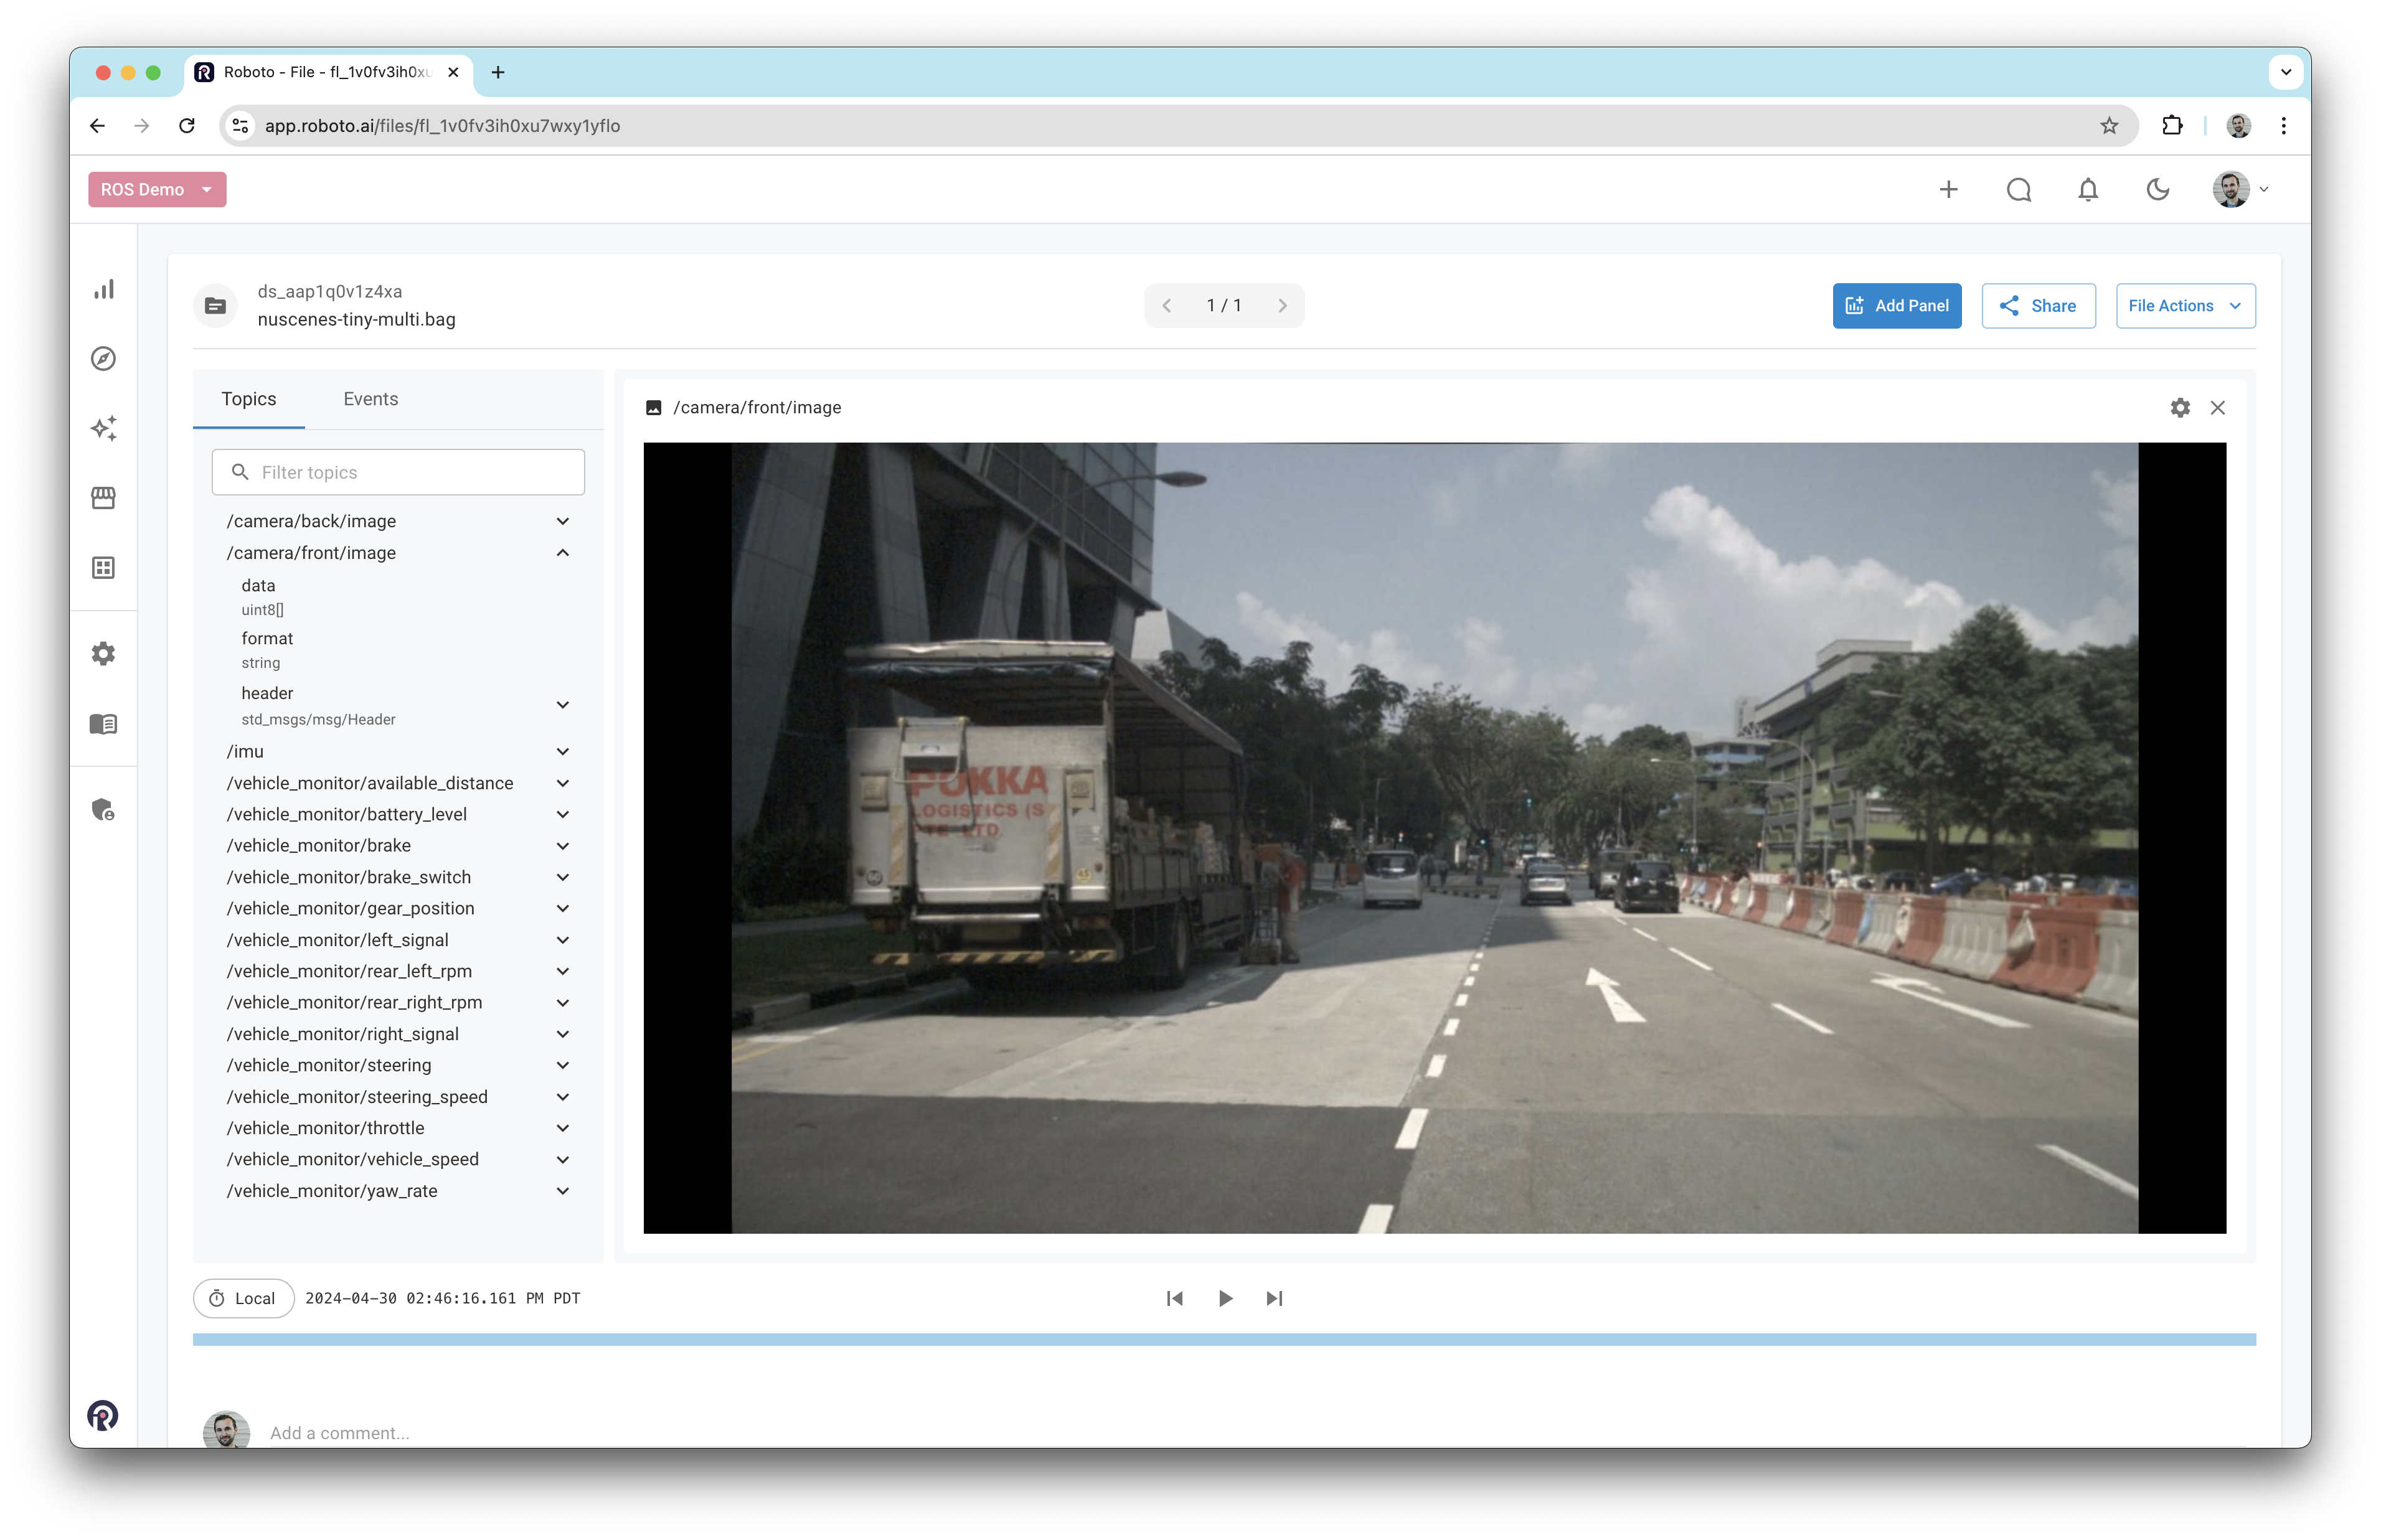
Visualize data#
Once the log file has been ingested, you can double click on it to be taken to the visualizer. You can learn more about visualizing ROS data at Visualize Data.
Expand the /camera/front/image topic in the left sidebar and drag the data message path into the workspace.
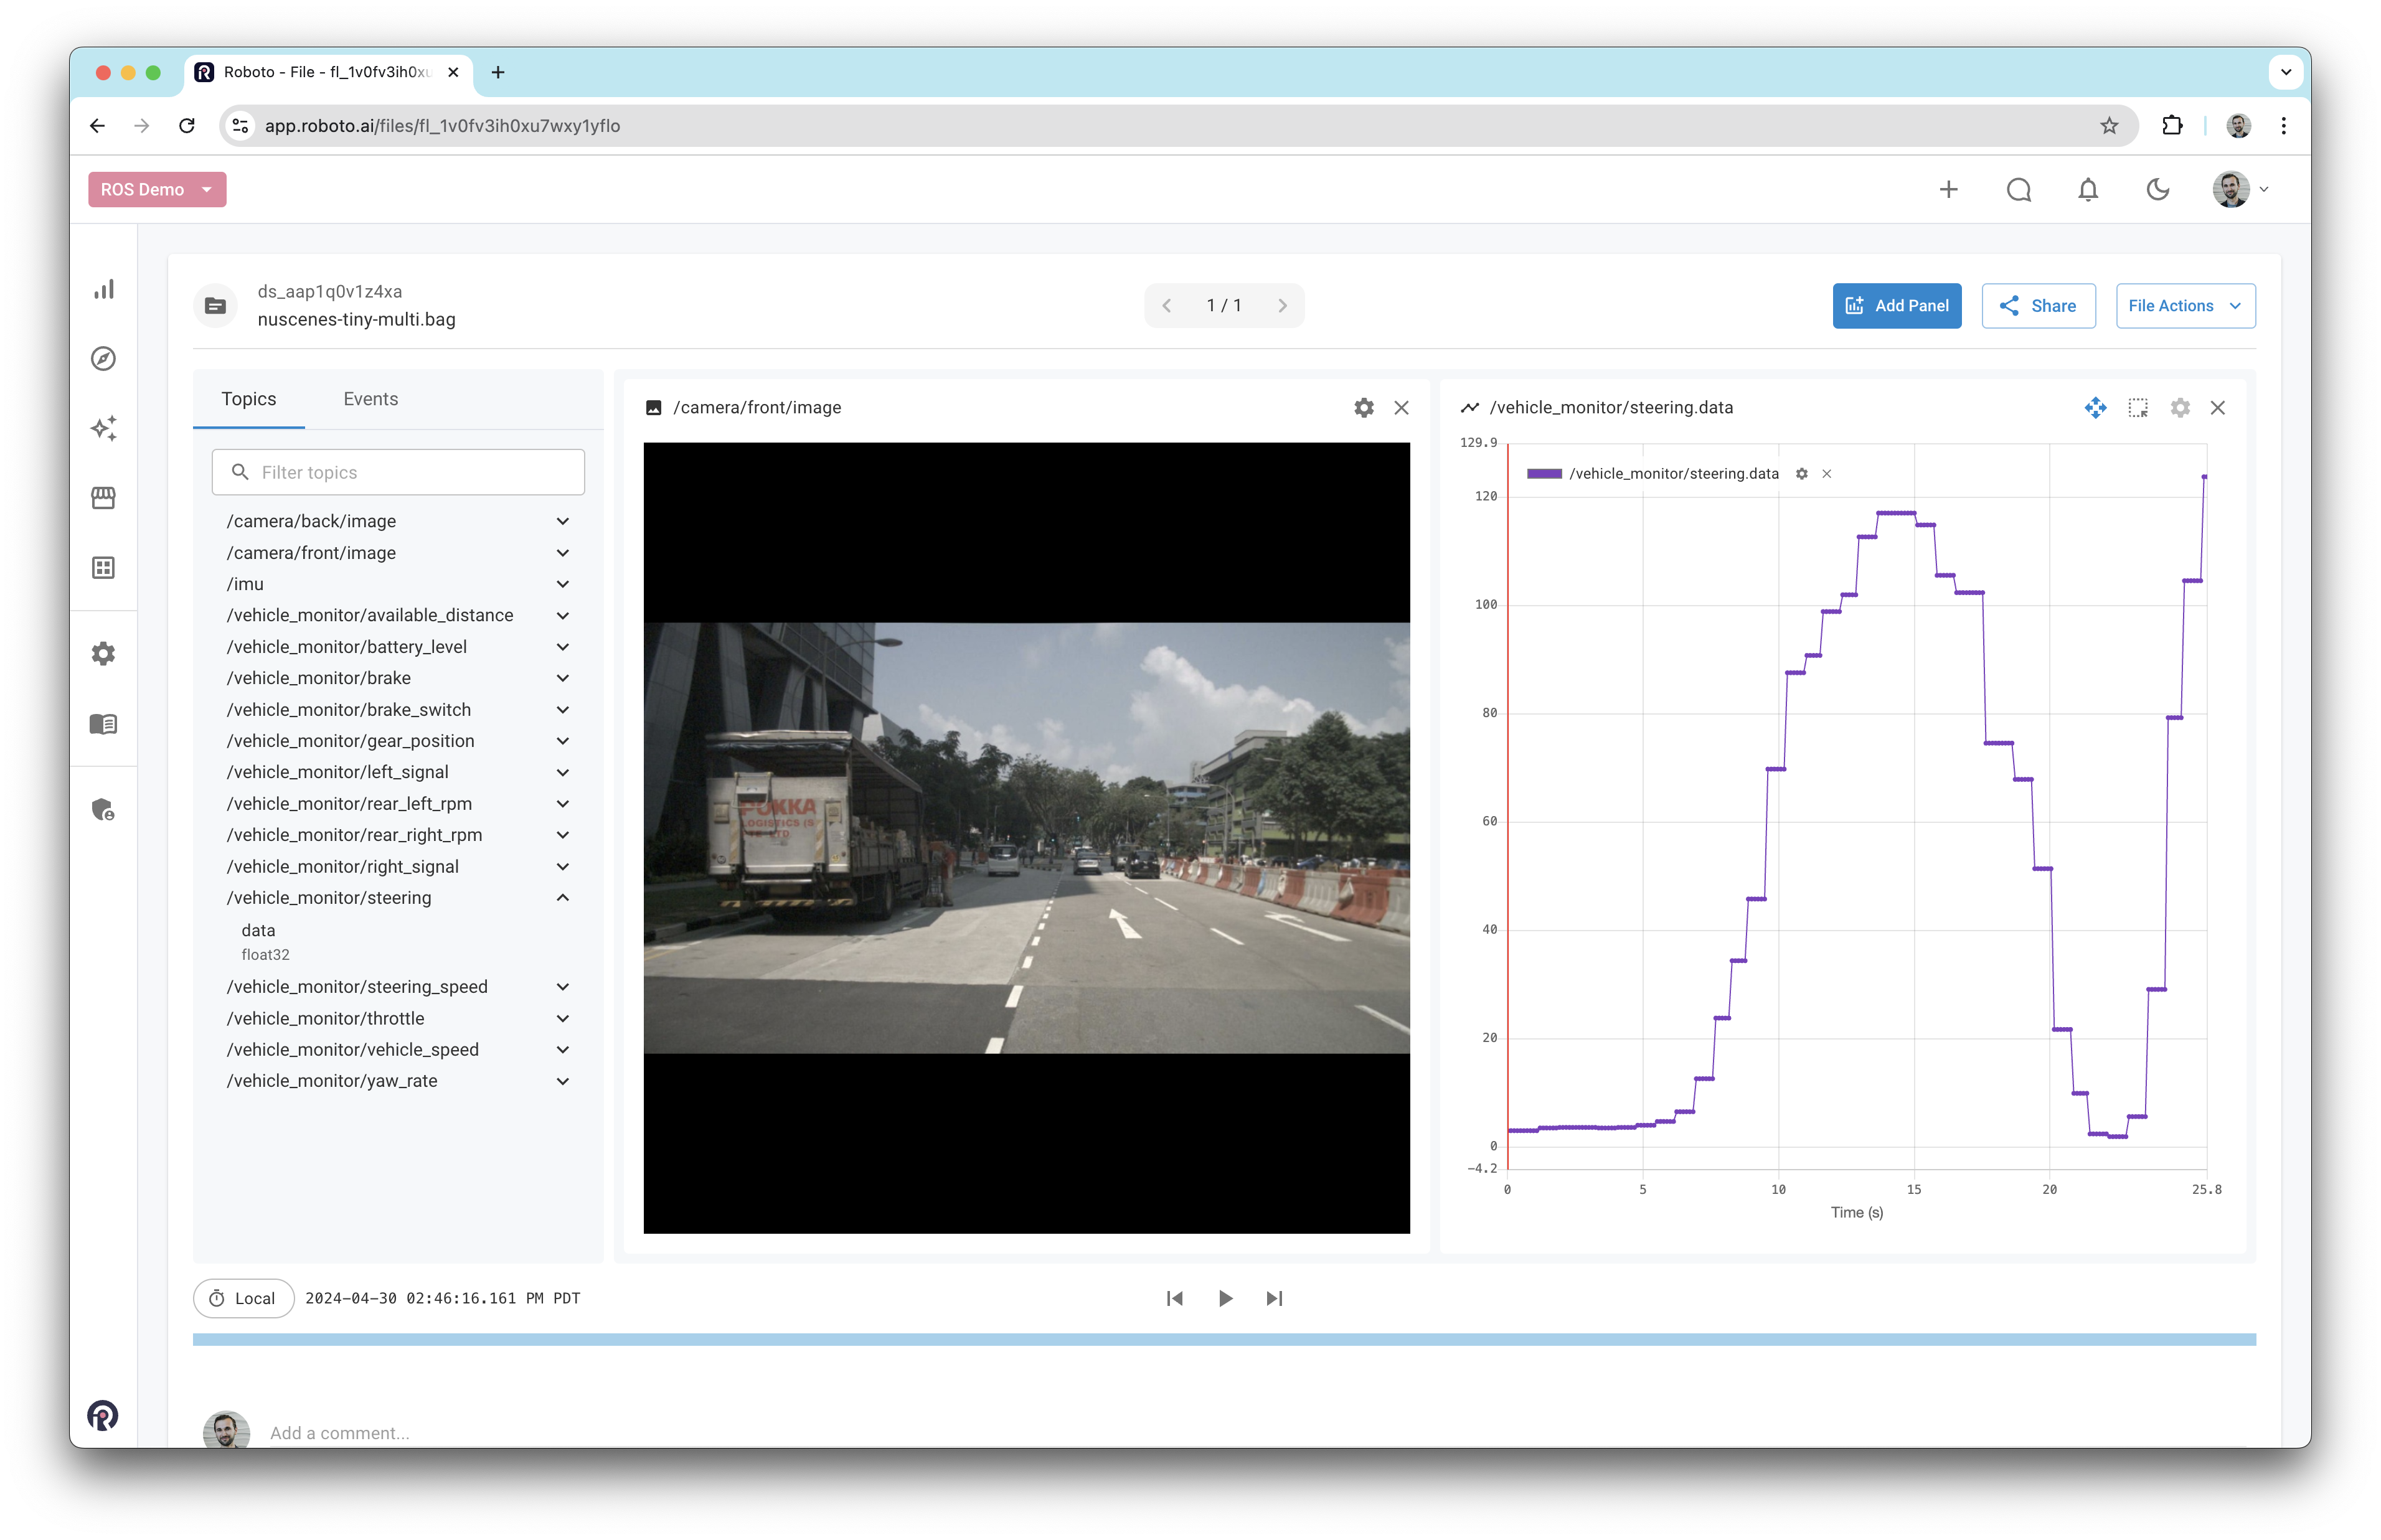
Then, expand the /vehicle_monitor/steering topic and drag the data message path into the workspace, splitting the current workspace in half.
Associating events with entities#
An event can be linked to one or many datasets, files, topics, or message paths. Here’s when to use each:
Dataset Event: Use this for events that affect the entire dataset. For example, if a crash occurred during a drone flight and the dataset represents the whole flight, associate the event “crash” with the dataset. This ensures the event covers all files and topics related to that flight within the relevant time span.
File Event: If the dataset contains multiple files (e.g., per-topic
.mcapfiles) and the event is specific to one file, such as a “hard landing” in one test flight, associate the event with that file only.Topic Event: For more granular events, like detecting a period of increased vibration in accelerometer data, associate the event with the relevant topic (e.g., the IMU topic).
Message Path Event: For the most detailed level, use message paths. For instance, if a health check action detects a ground control station (GCS) connection loss, you could associate the event with the
gcs_connection_lostmessage path in thevehicle_statustopic.
In this walk through, we’re going to create an event on the steering_wheel.data message path.
Create an event#
With the camera data and steering wheel data in view, we can use the plot panel to create a new event.
First, click the region selector icon in the top-right corner of the plot panel.
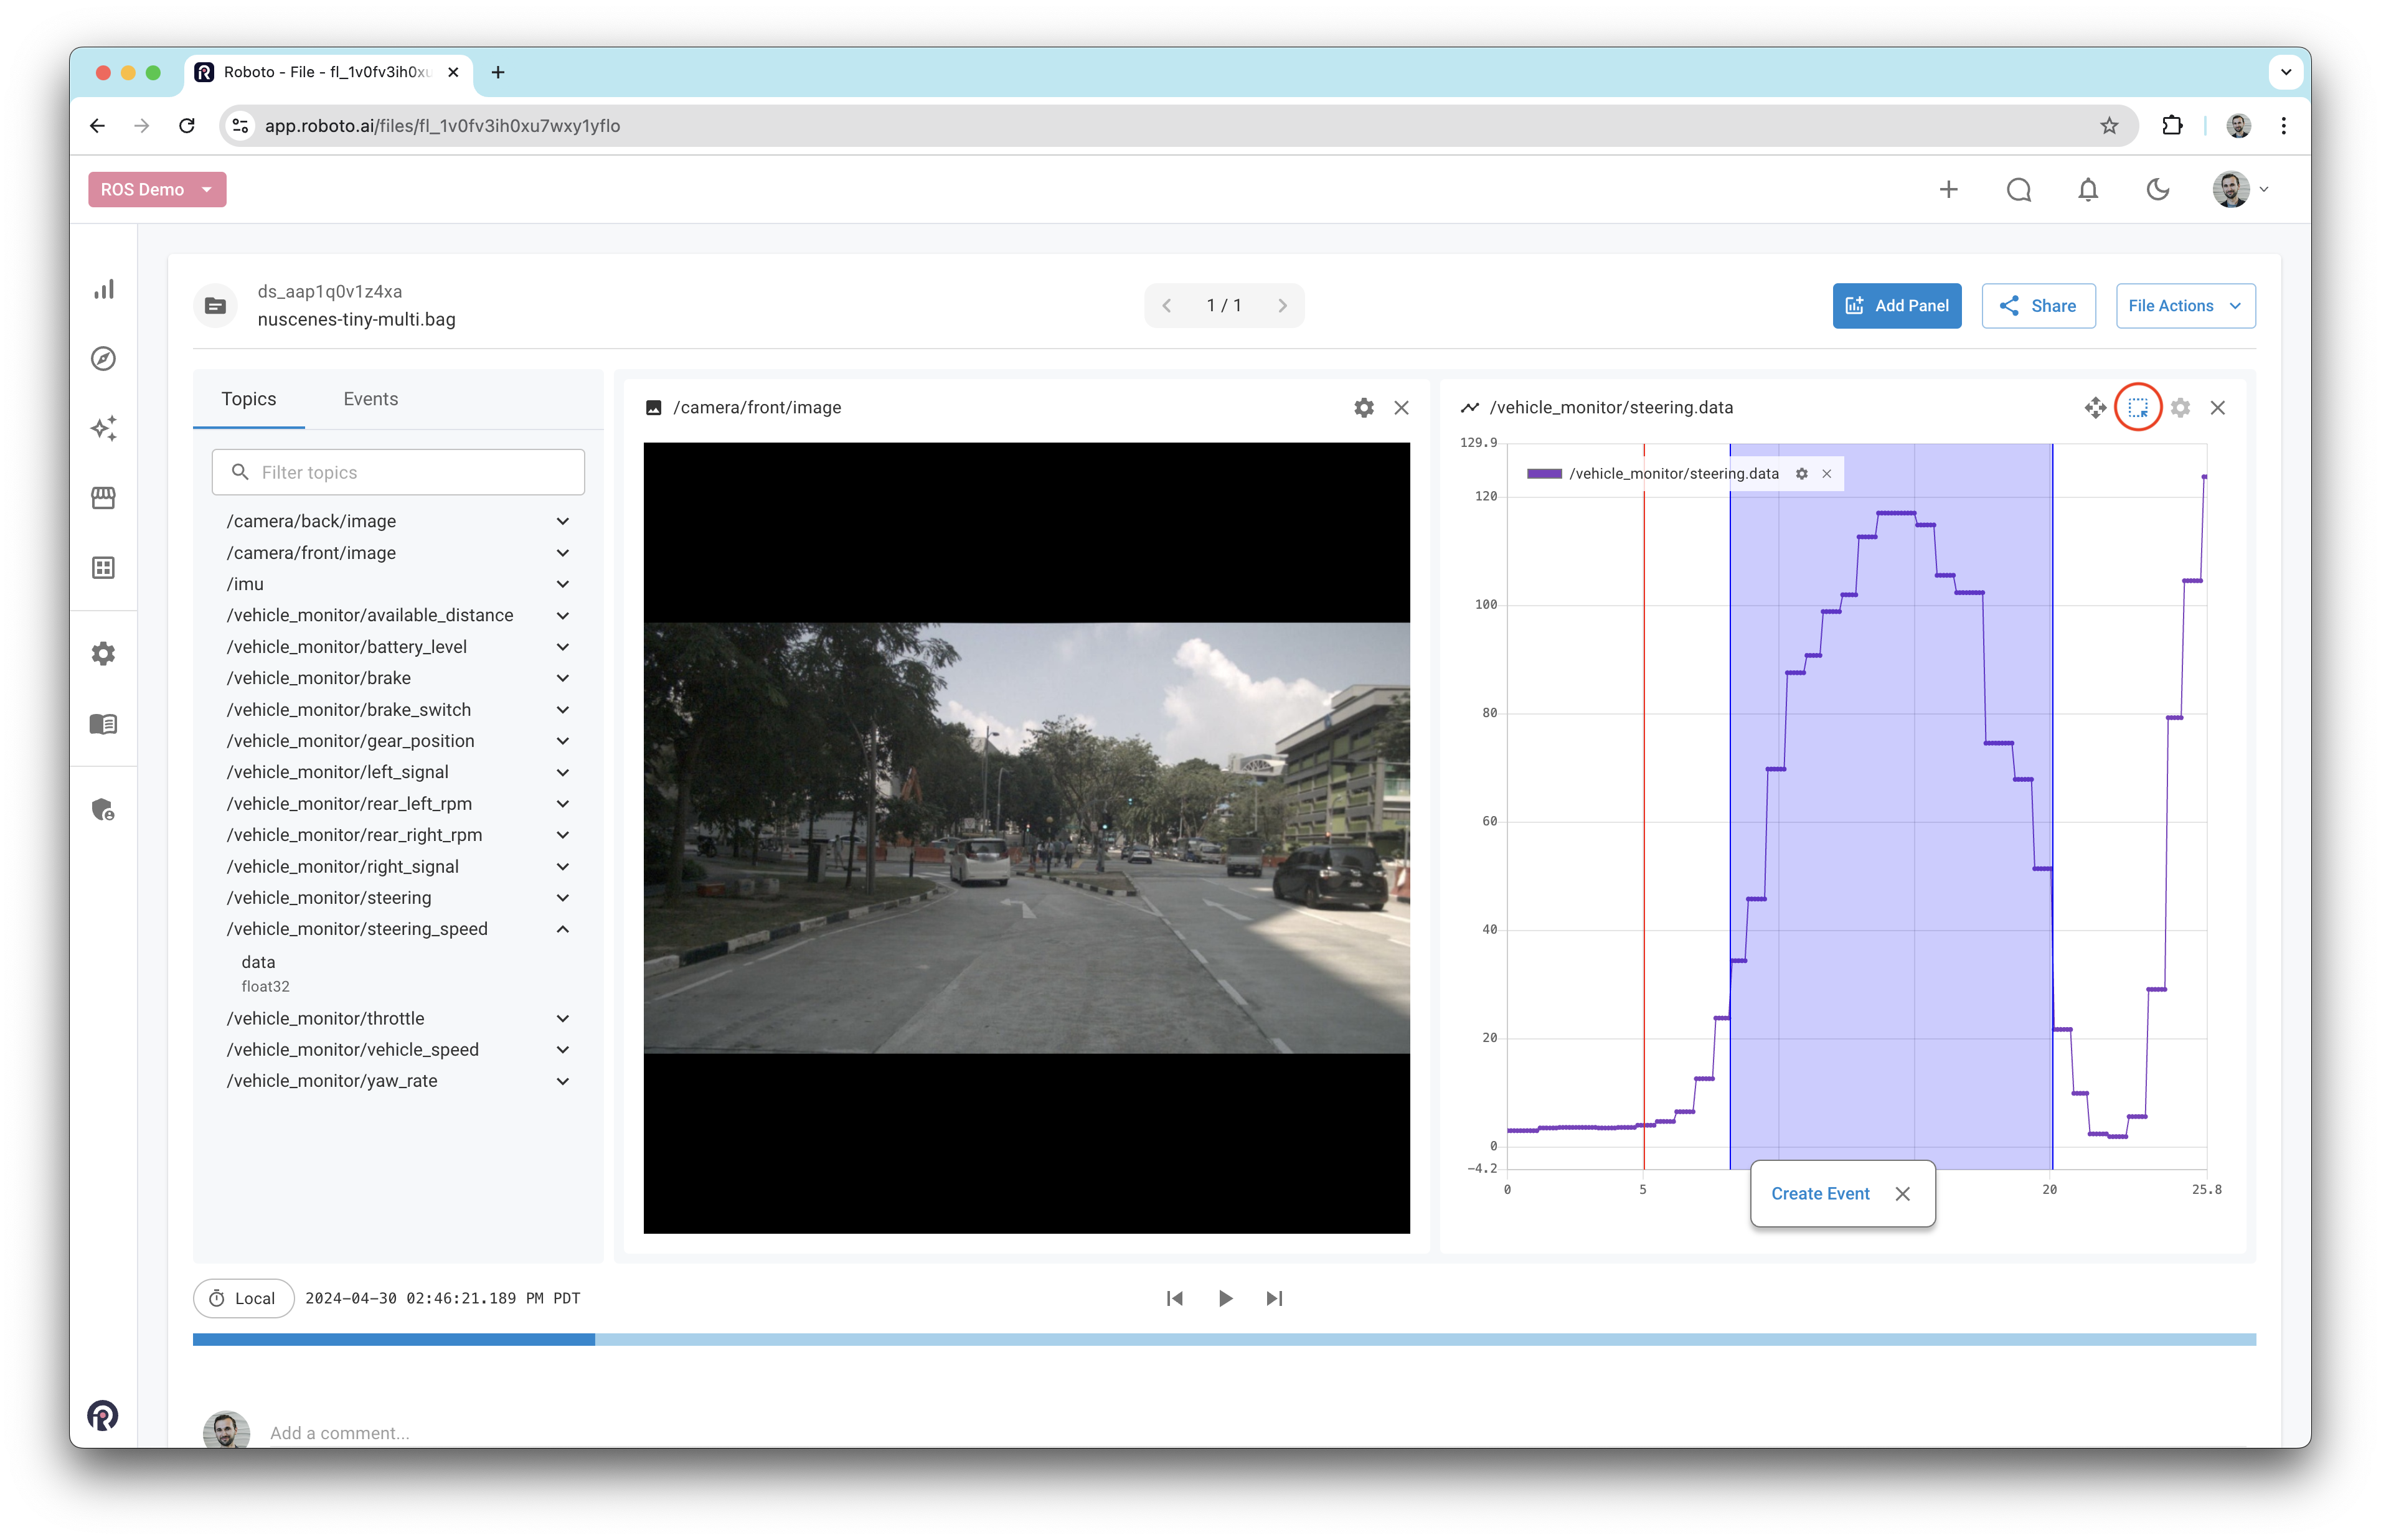
Then, drag a region around the section of the steering wheel plot that corresponds to the car turning left; this looks like an upside-down U shape.
A small popup will appear asking if you want to create an event on this region of data. Click the button and a new form will push in from the left.
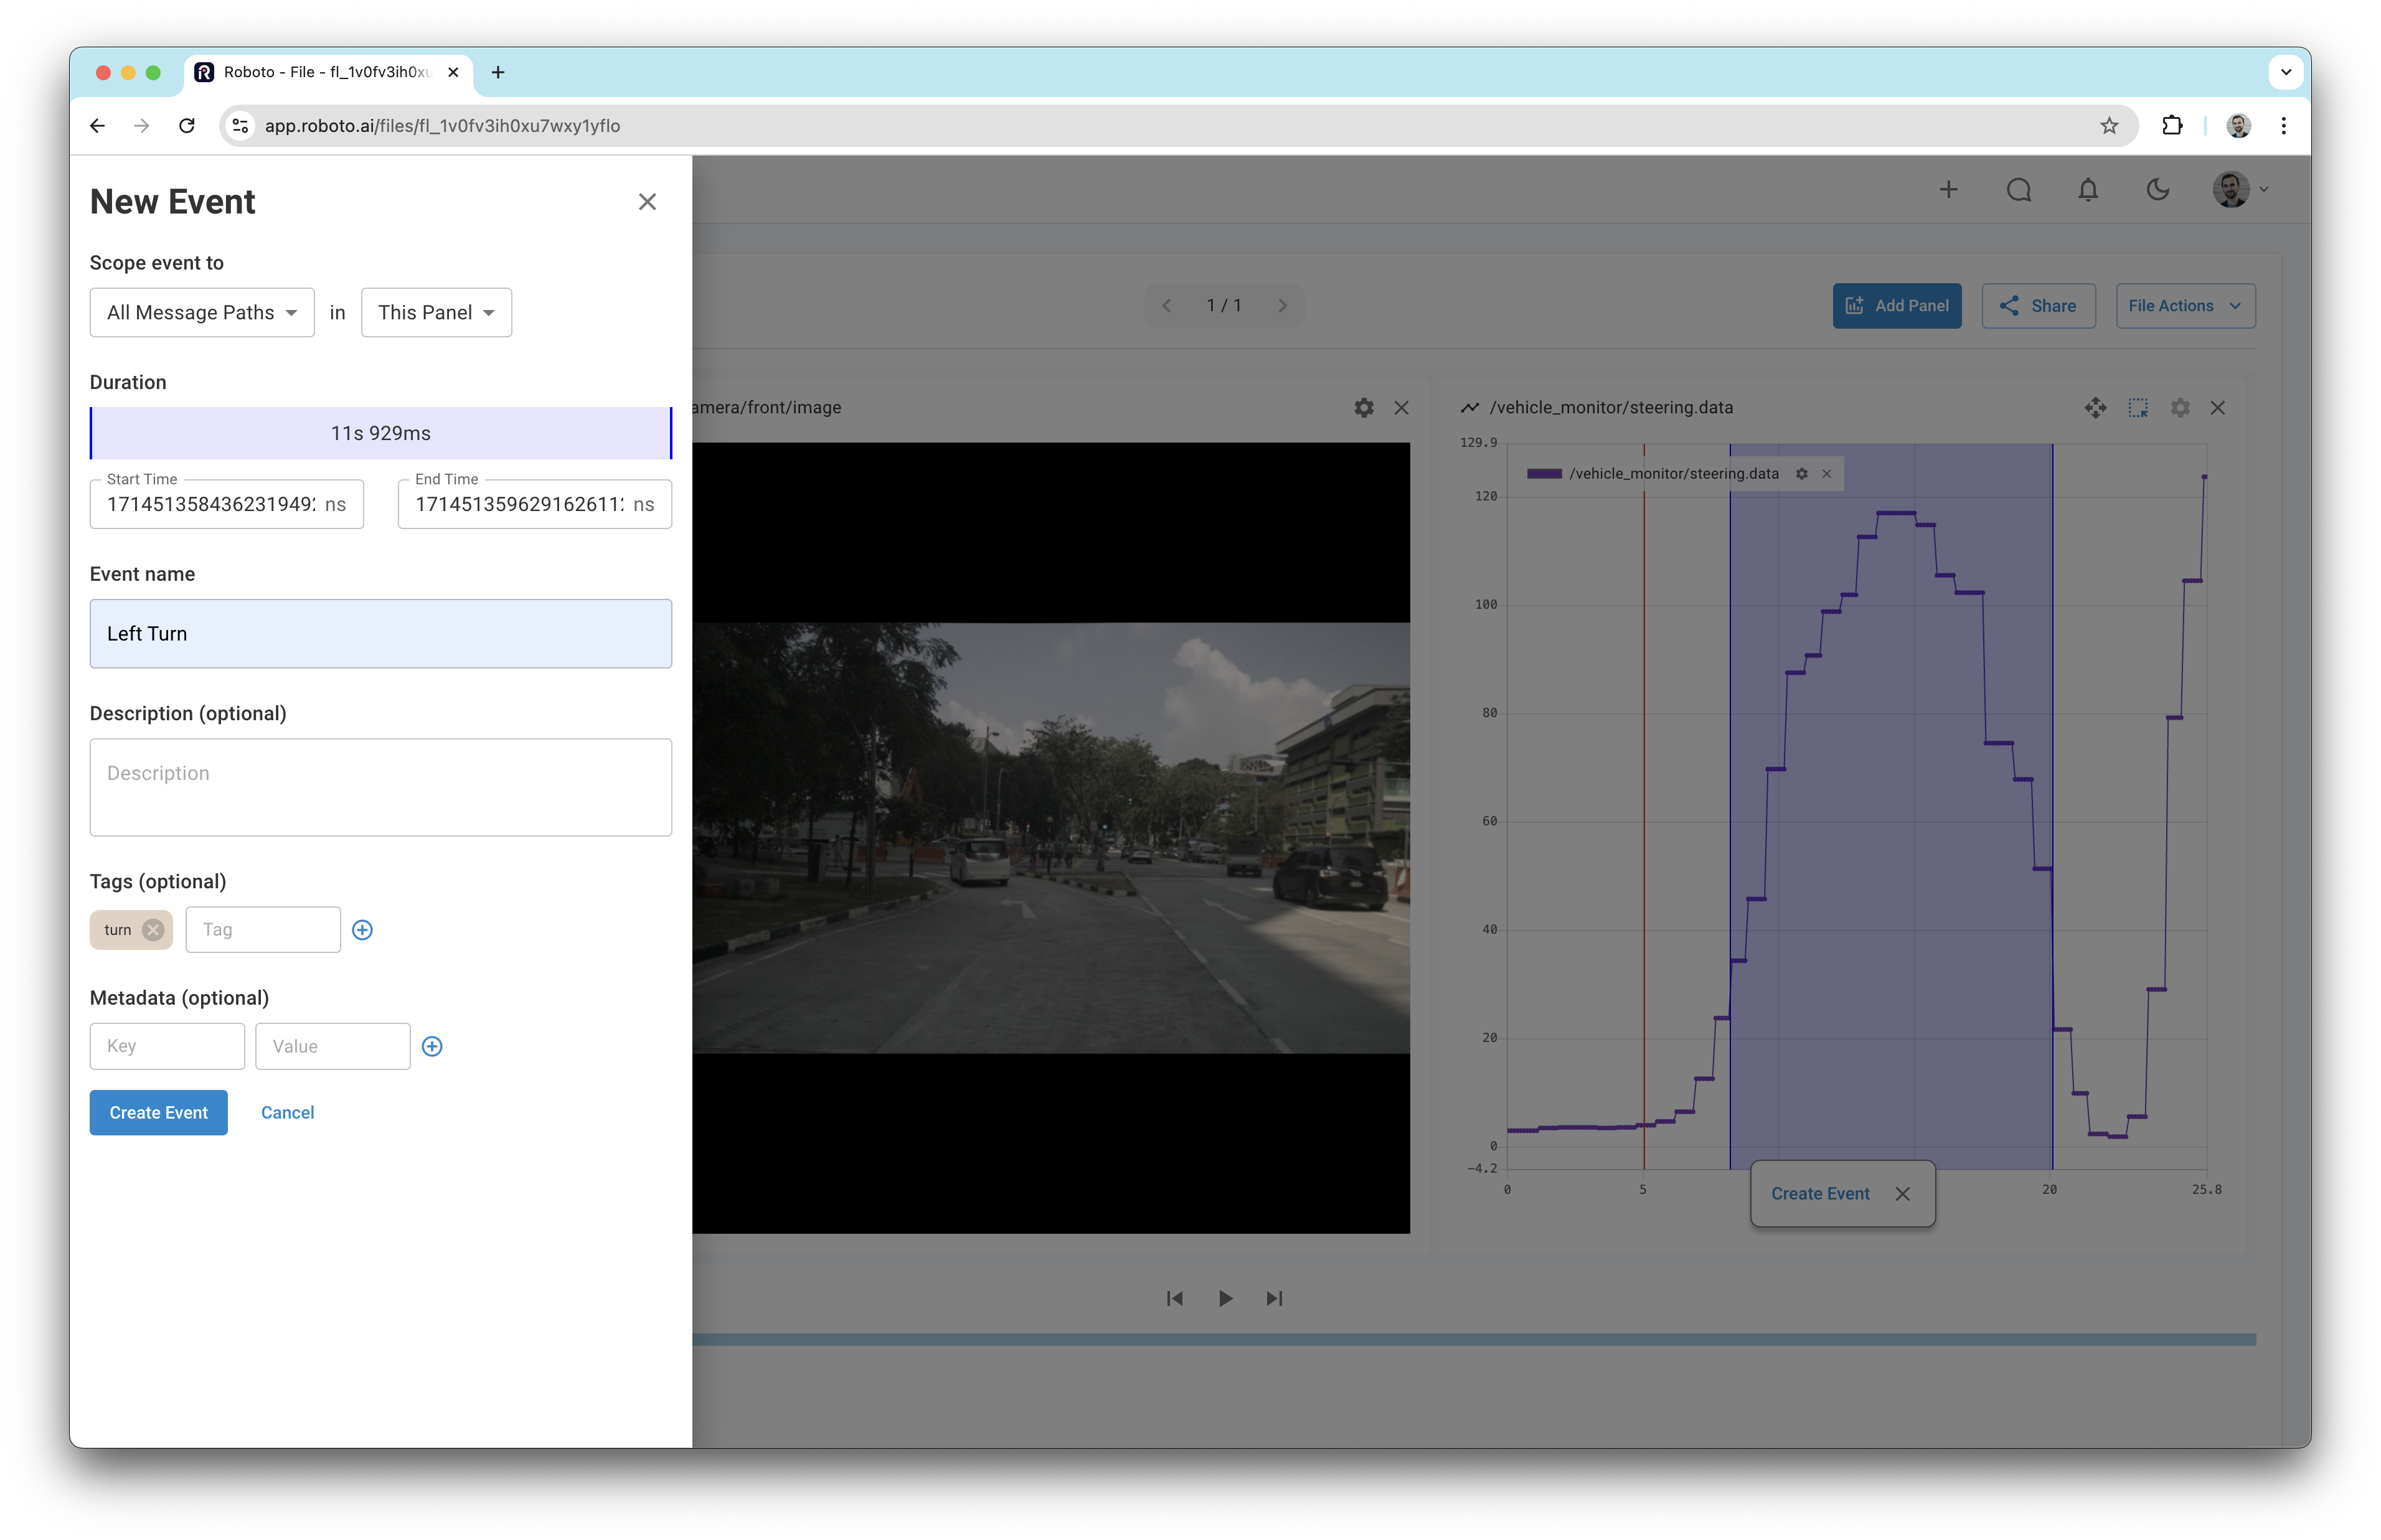
Notice that the top of the form defaults to scoping the event to All Message Paths in This Panel. As discussed in the previous section, events can be associated with different entities. You can adjust the event scope by clicking the dropdown and selecting the desired entity. However, for this example, leave the scope as All Message Paths. This ensures that only the steering_wheel.data message path open in the plot panel will be captured in the event.
Complete the form with any remaining details and then click the final Create Event button.
You should now see the event appear on the plot panel, and also underneath the timeline.

If you hover over the event in the timeline, you’ll see some additional details. Clicking on the event will open it in the sidebar where you can modify any details, or delete it.
Fetch event data with the SDK#
Roboto makes it easy to fetch slices of data that you’ve annotated with events using the Python SDK. You can also create events programmatically with the SDK using Event.create.
The following examples are best executed in an IPython environment such as a JupyterLab notebook.
List events in a dataset#
Here we use Event.get_by_dataset to get all events associated with a dataset.
from roboto import Dataset, Event

events = list(Event.get_by_dataset("ds_aap1q0v1z4xa"))

for event in events:
    print(event.name, event.start_time, event.end_time)
Note, you’ll need to replace the Dataset ID with your own.
Get event data and plot it#
Next we use Event.get_data_as_df to get the event data as a dataframe.
We can call .plot() on the returned dataframe to see the data in a graph. You can also preview the dataframe by calling .head().
event = events[0]

df = event.get_data_as_df()
df.plot()

See that the data in the graph corresponds to the region that we annotated previously.
Get corresponding images for event#
from IPython.display import display, Image

ds = Dataset.from_id("ds_aap1q0v1z4xa")
file = ds.get_file_by_path("nuscenes-tiny-multi.bag")

# Get camera topic with image data
camera_topic = file.get_topic("/camera/front/image")

# Fetch image data corresponding to the event start and end time
camera_data = camera_topic.get_data(
    start_time=event.start_time,
    end_time=event.end_time
)

# Show the images
for i, datum in enumerate(camera_data):
    display(Image(data=datum["data"], width=500))
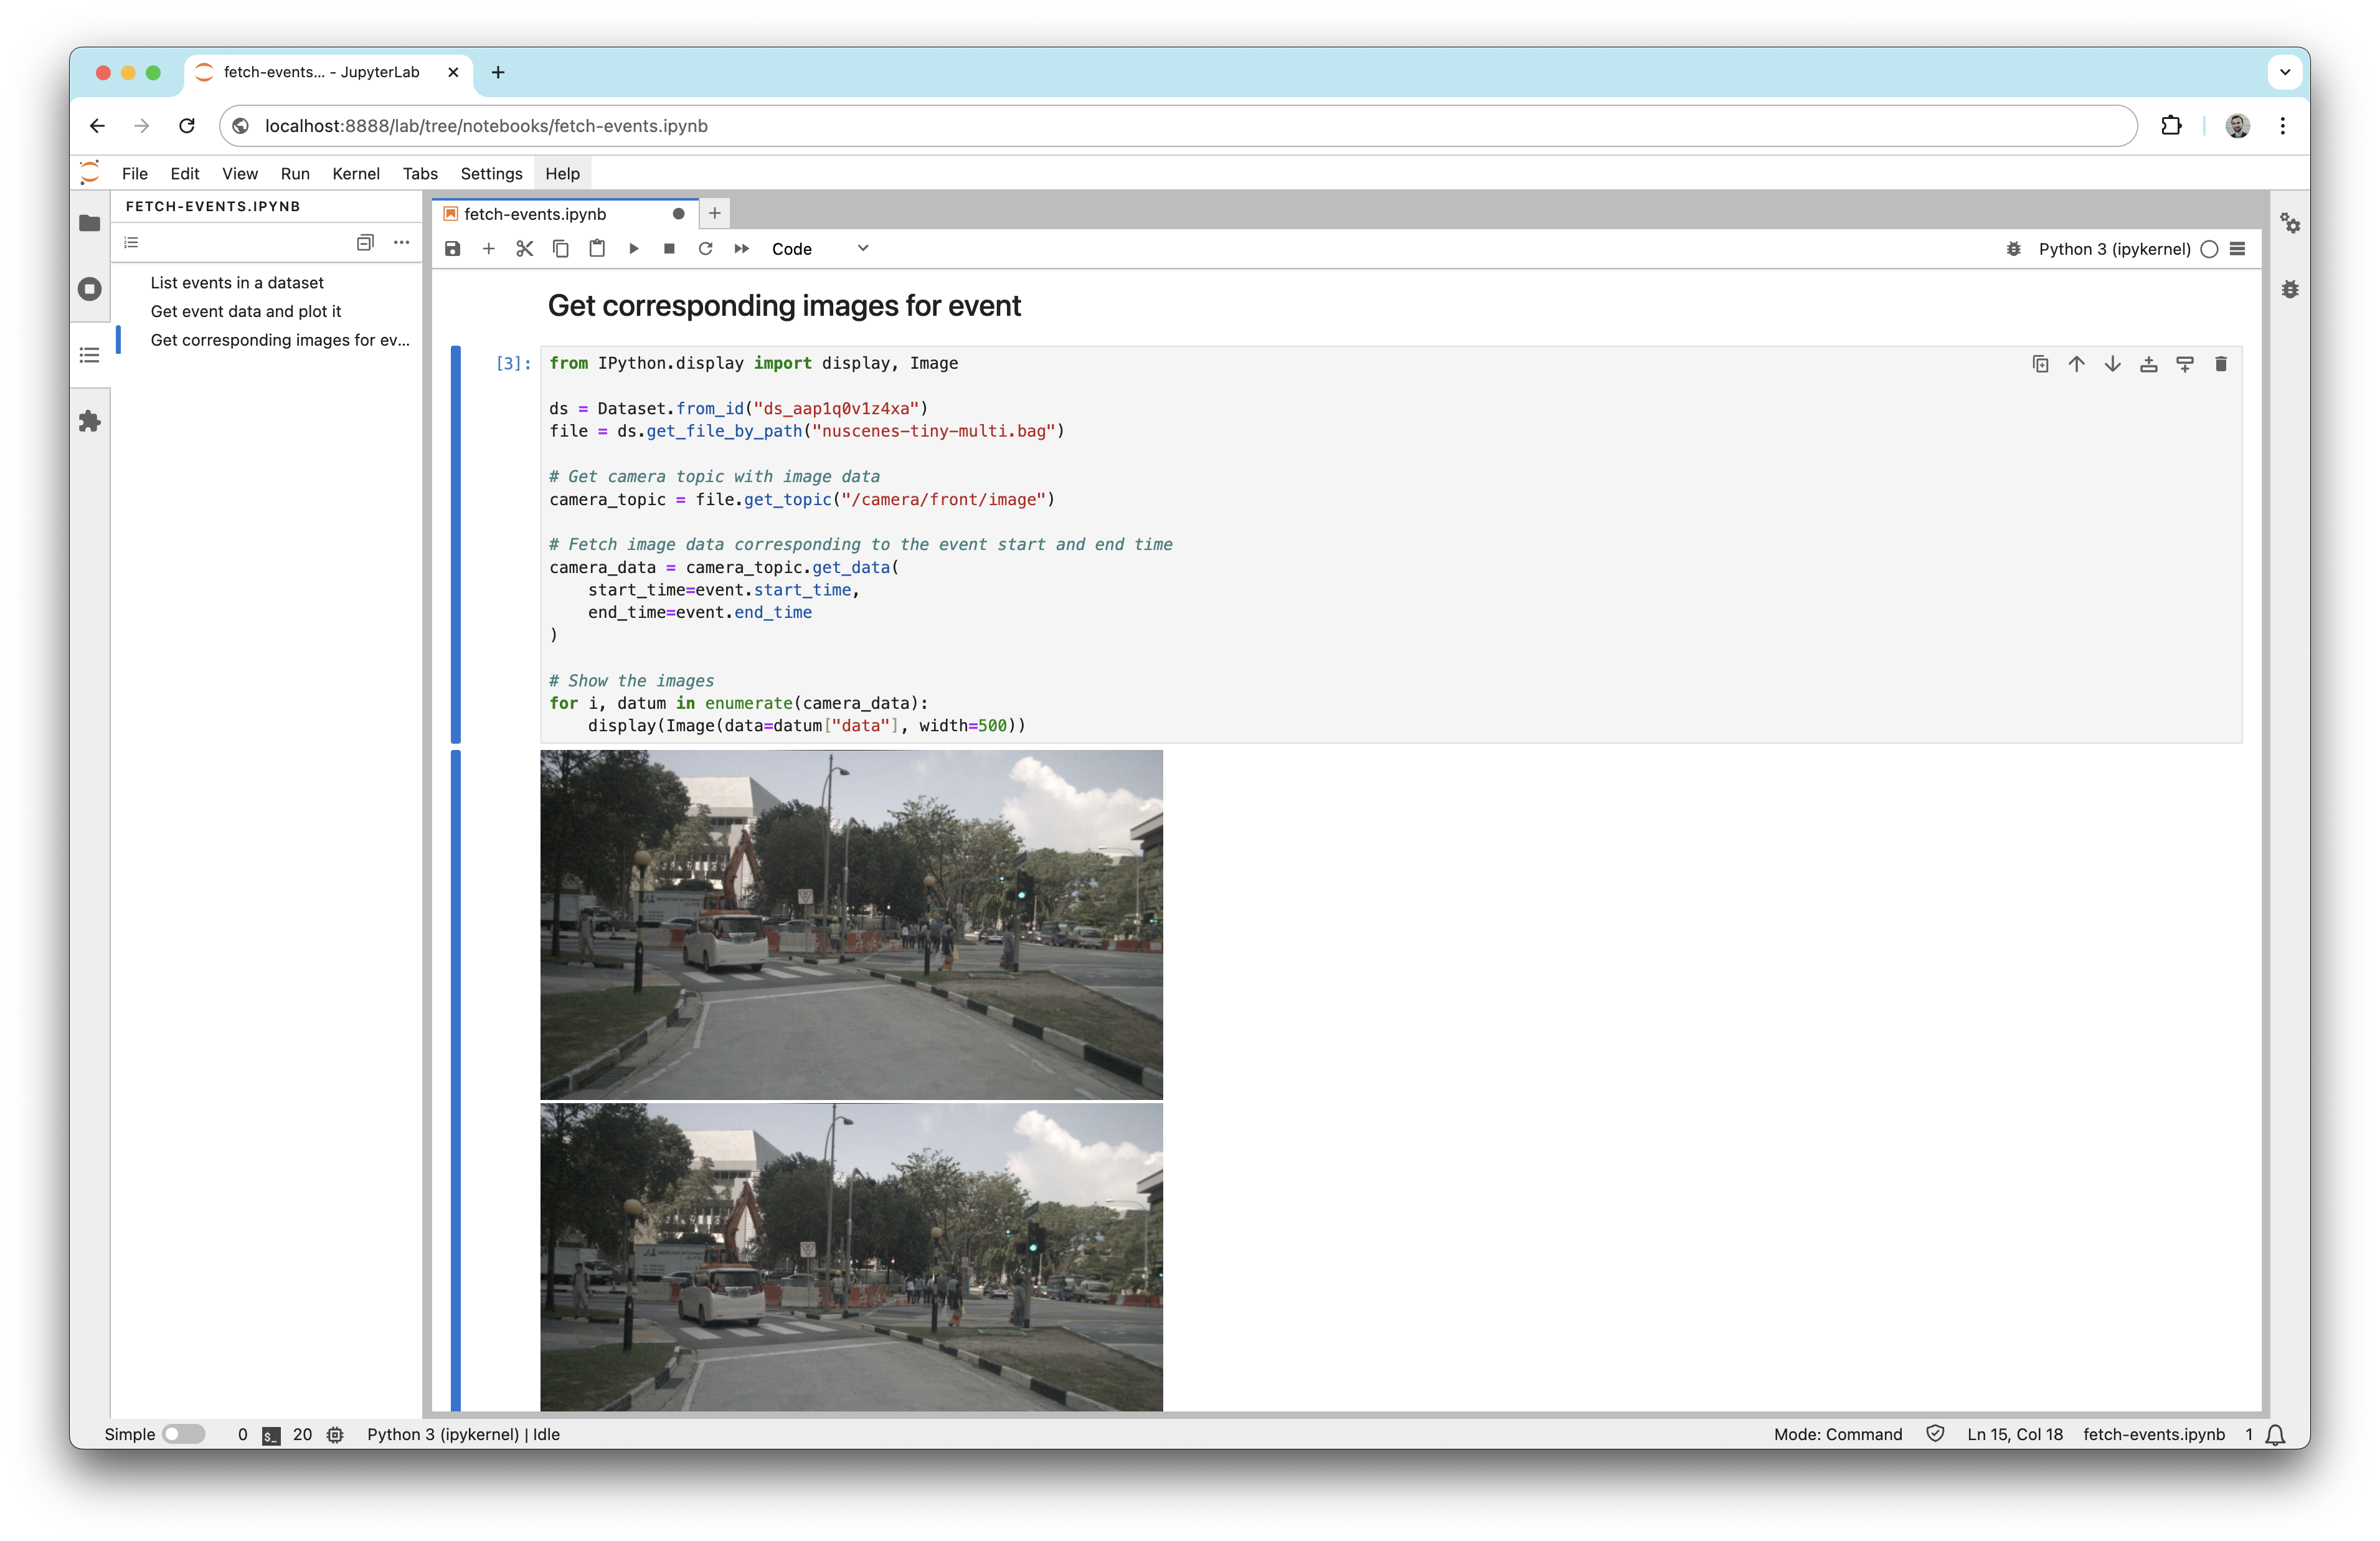
See that the images correspond to the moments in the drive where the car is turning left.