Visualize Data#
This section provides instructions on visualizing data from PX4 logs in Roboto.
Roboto supports the following types of panels for PX4 data:
Plot: Display numerical time-series data on charts.
Log: Display numerical or console log data in a table.
Map: Display geographic data on a map.
Raw: Display raw message data.
Plot data#
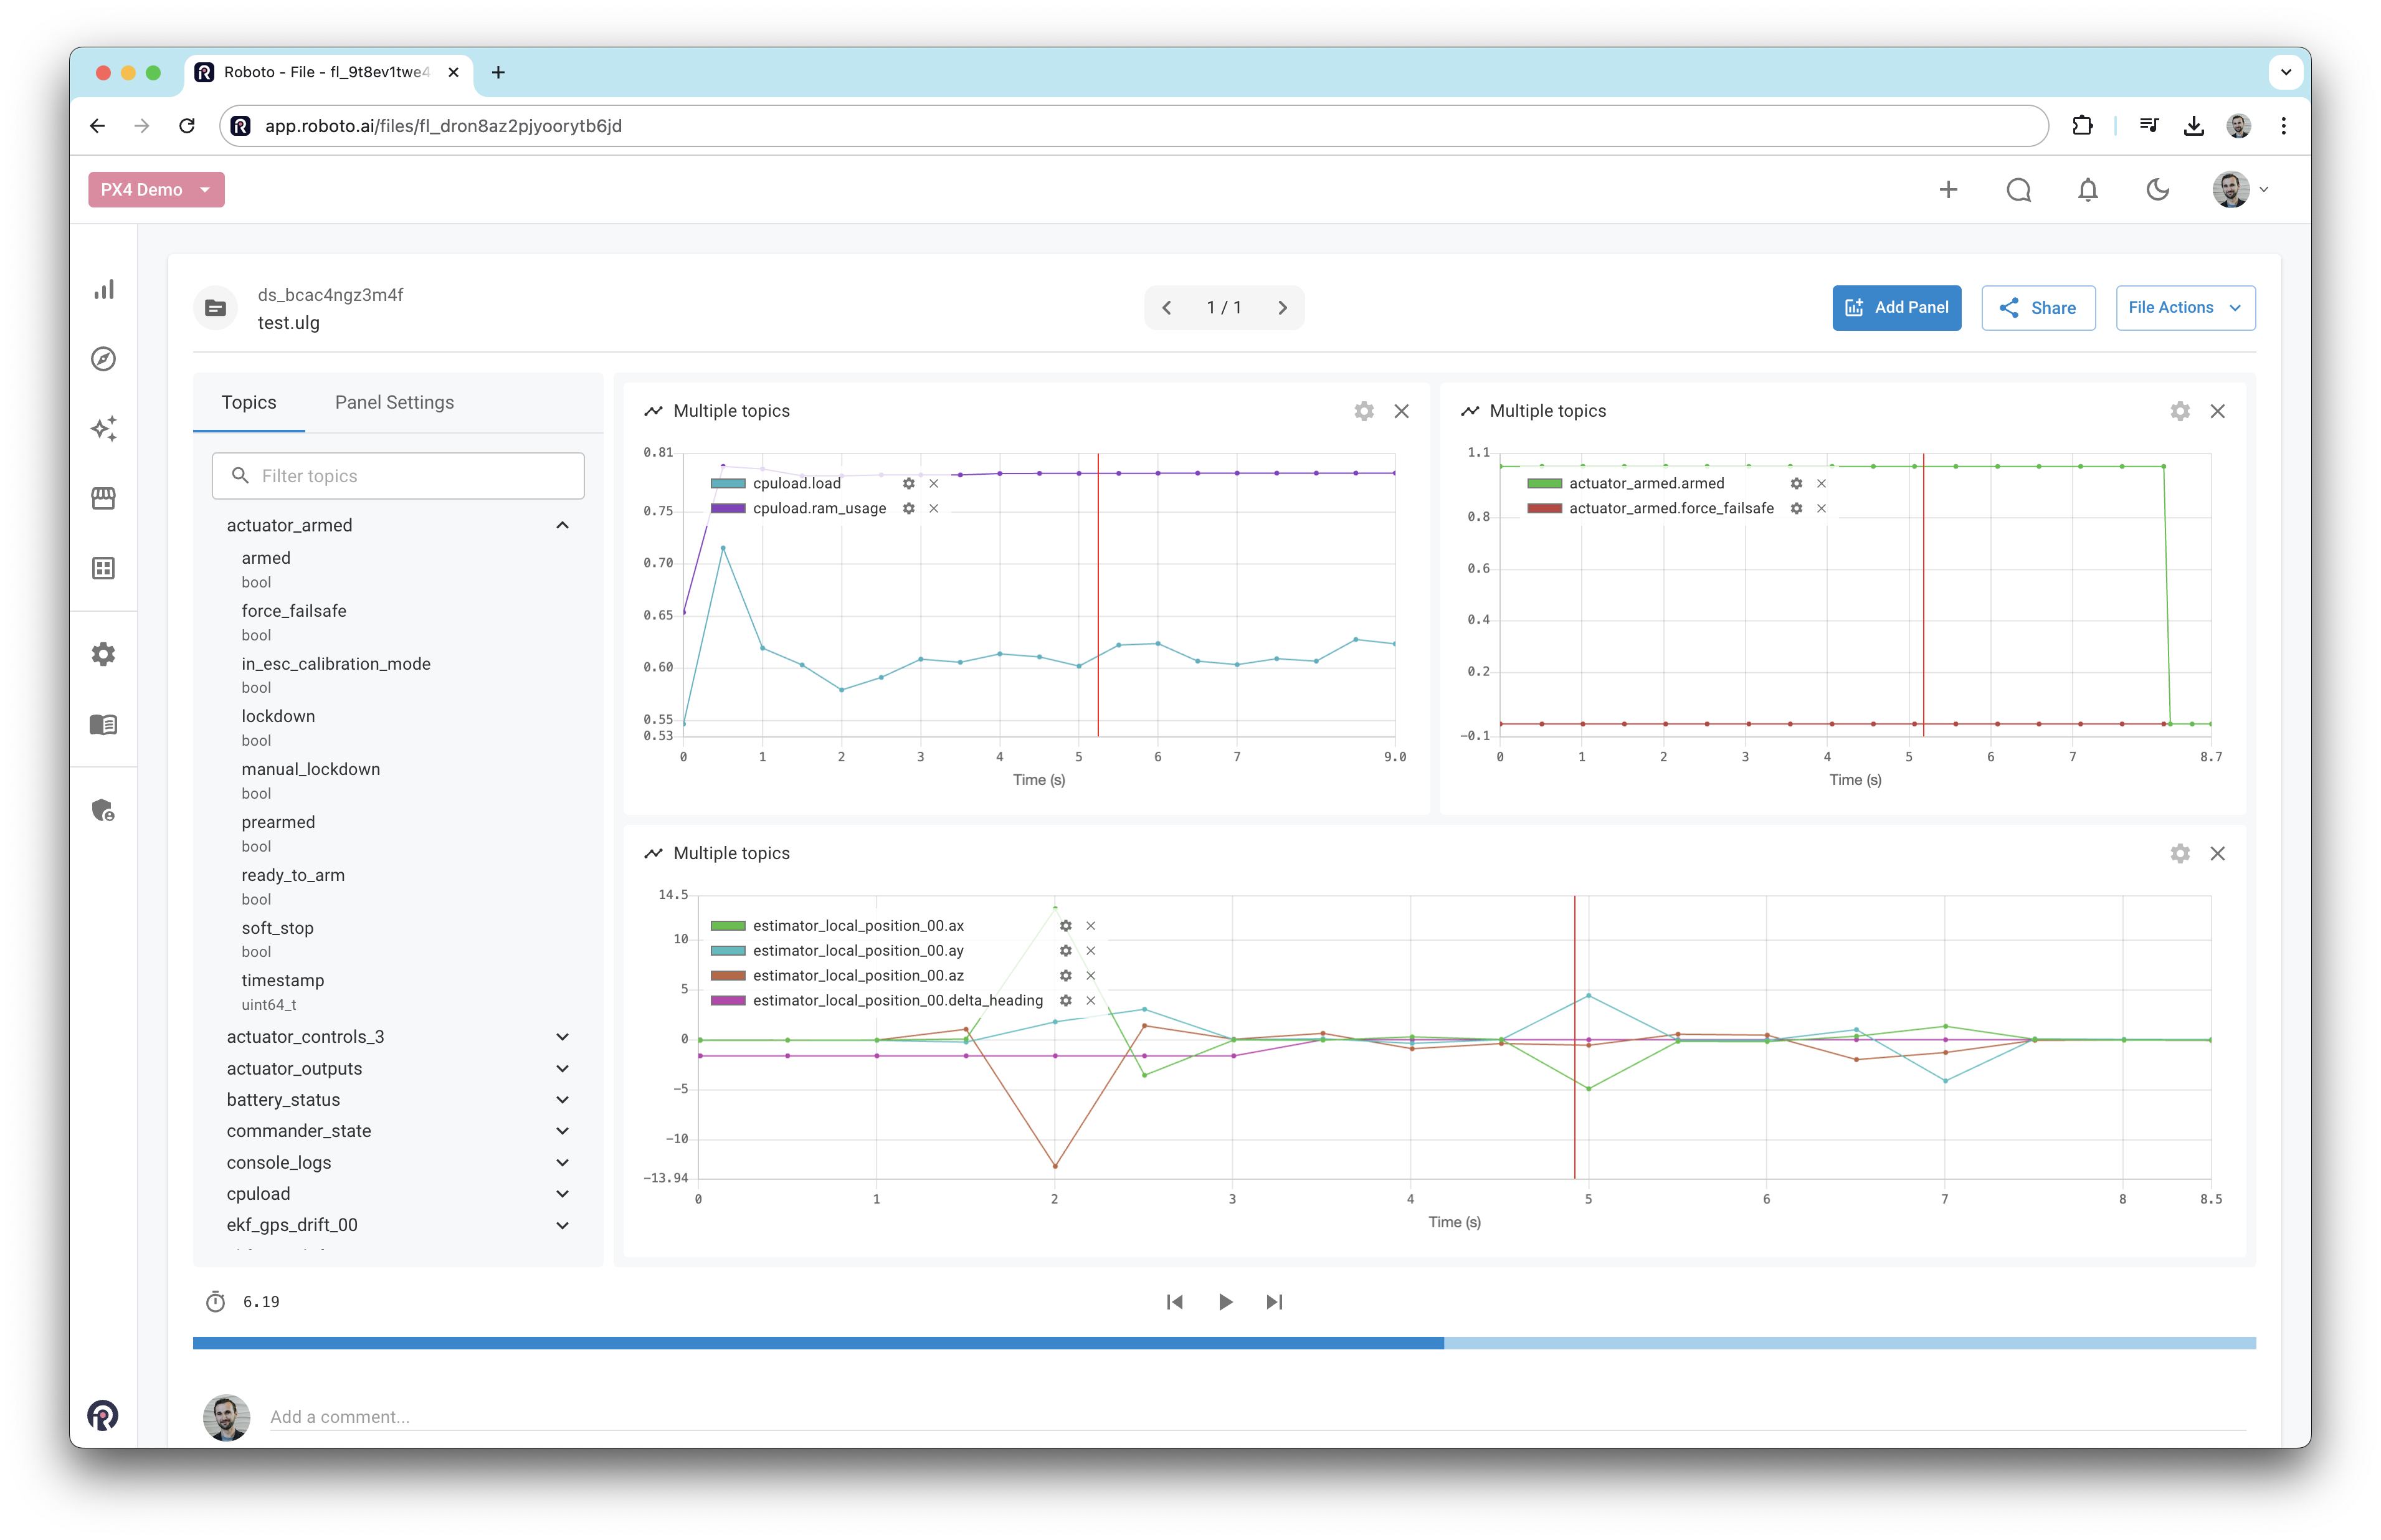
Once a log file has been ingested, double-click the file to open it in the Roboto visualizer. On the left-hand side, a list of all available topics and their fields will be displayed. To plot a field, drag it into the workspace. Alternatively, right-click on it and select View in Plot panel.
You can plot multiple fields in the same panel. Panels can be resized and moved around as needed.
You can also create events on data using the plot panel. See the Create Events on Data user guide for more details.
View console logs#
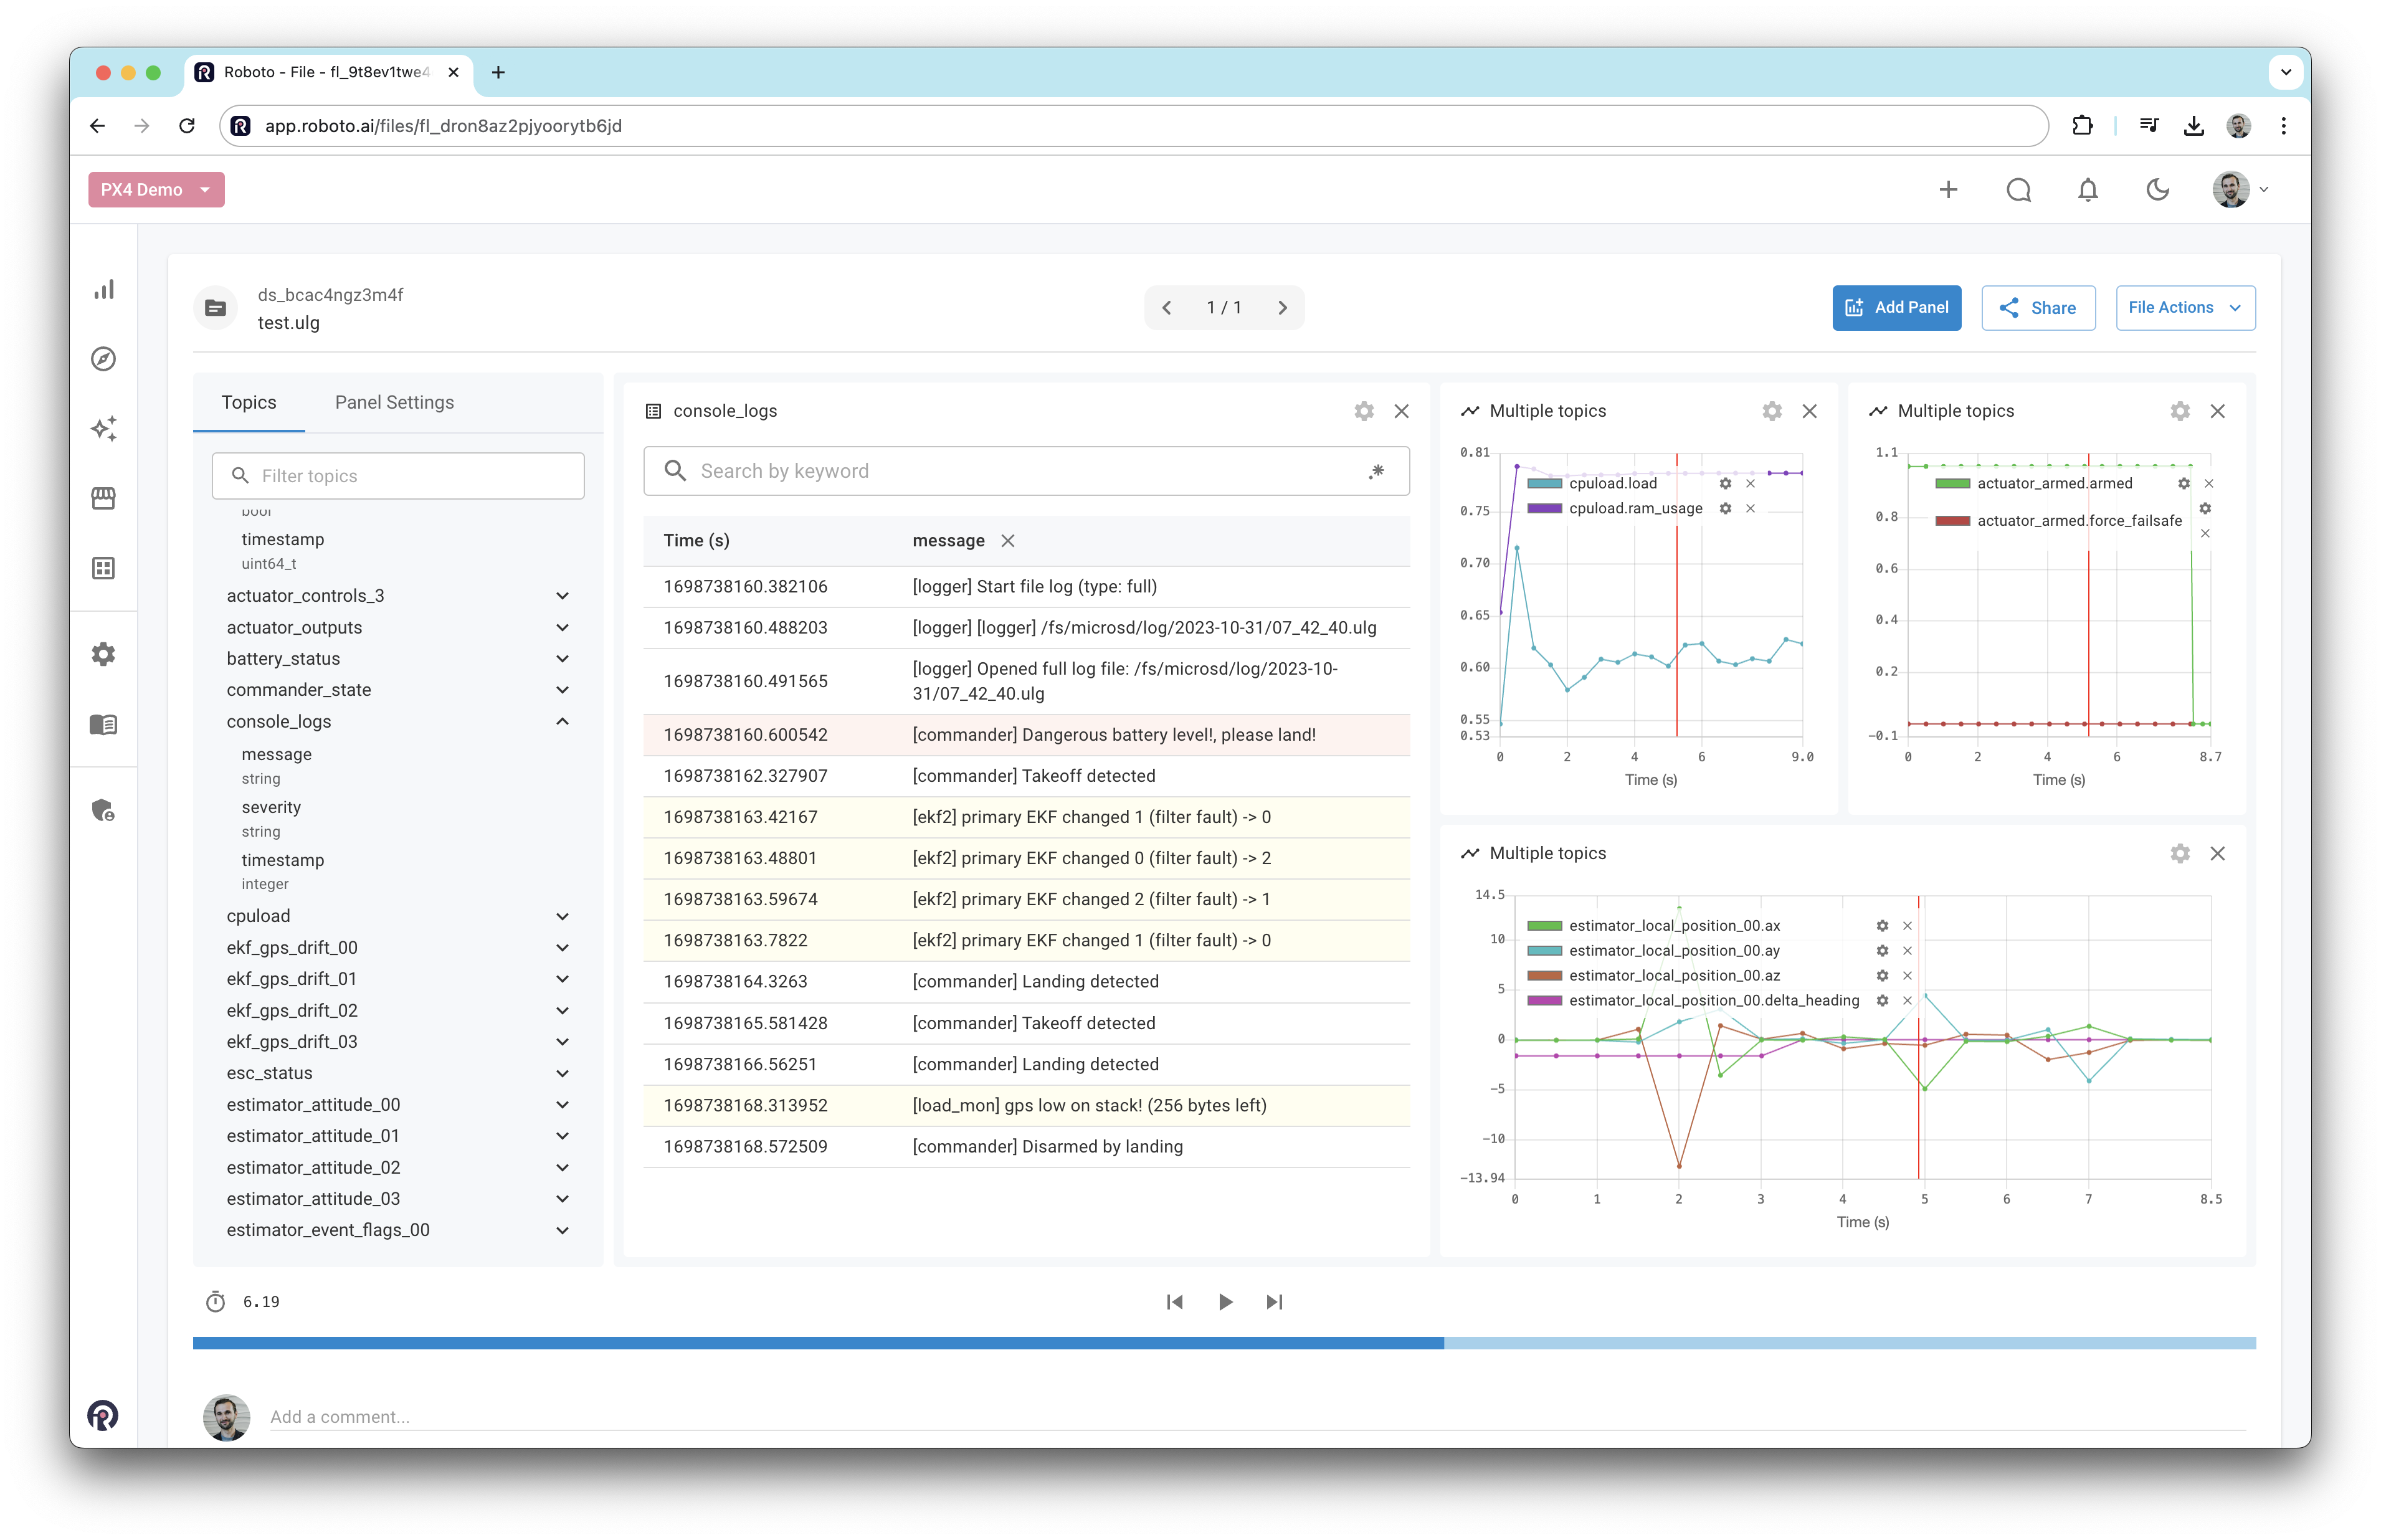
To display PX4 console logs, expand the console_logs topic in the topics list. Then, right-click on message and select View in Log panel.
You can also search for keywords within the console log panel, and toggle regex mode too. Clicking on a row in the panel will synchronize all other panels to the corresponding point in time.
View raw messages#
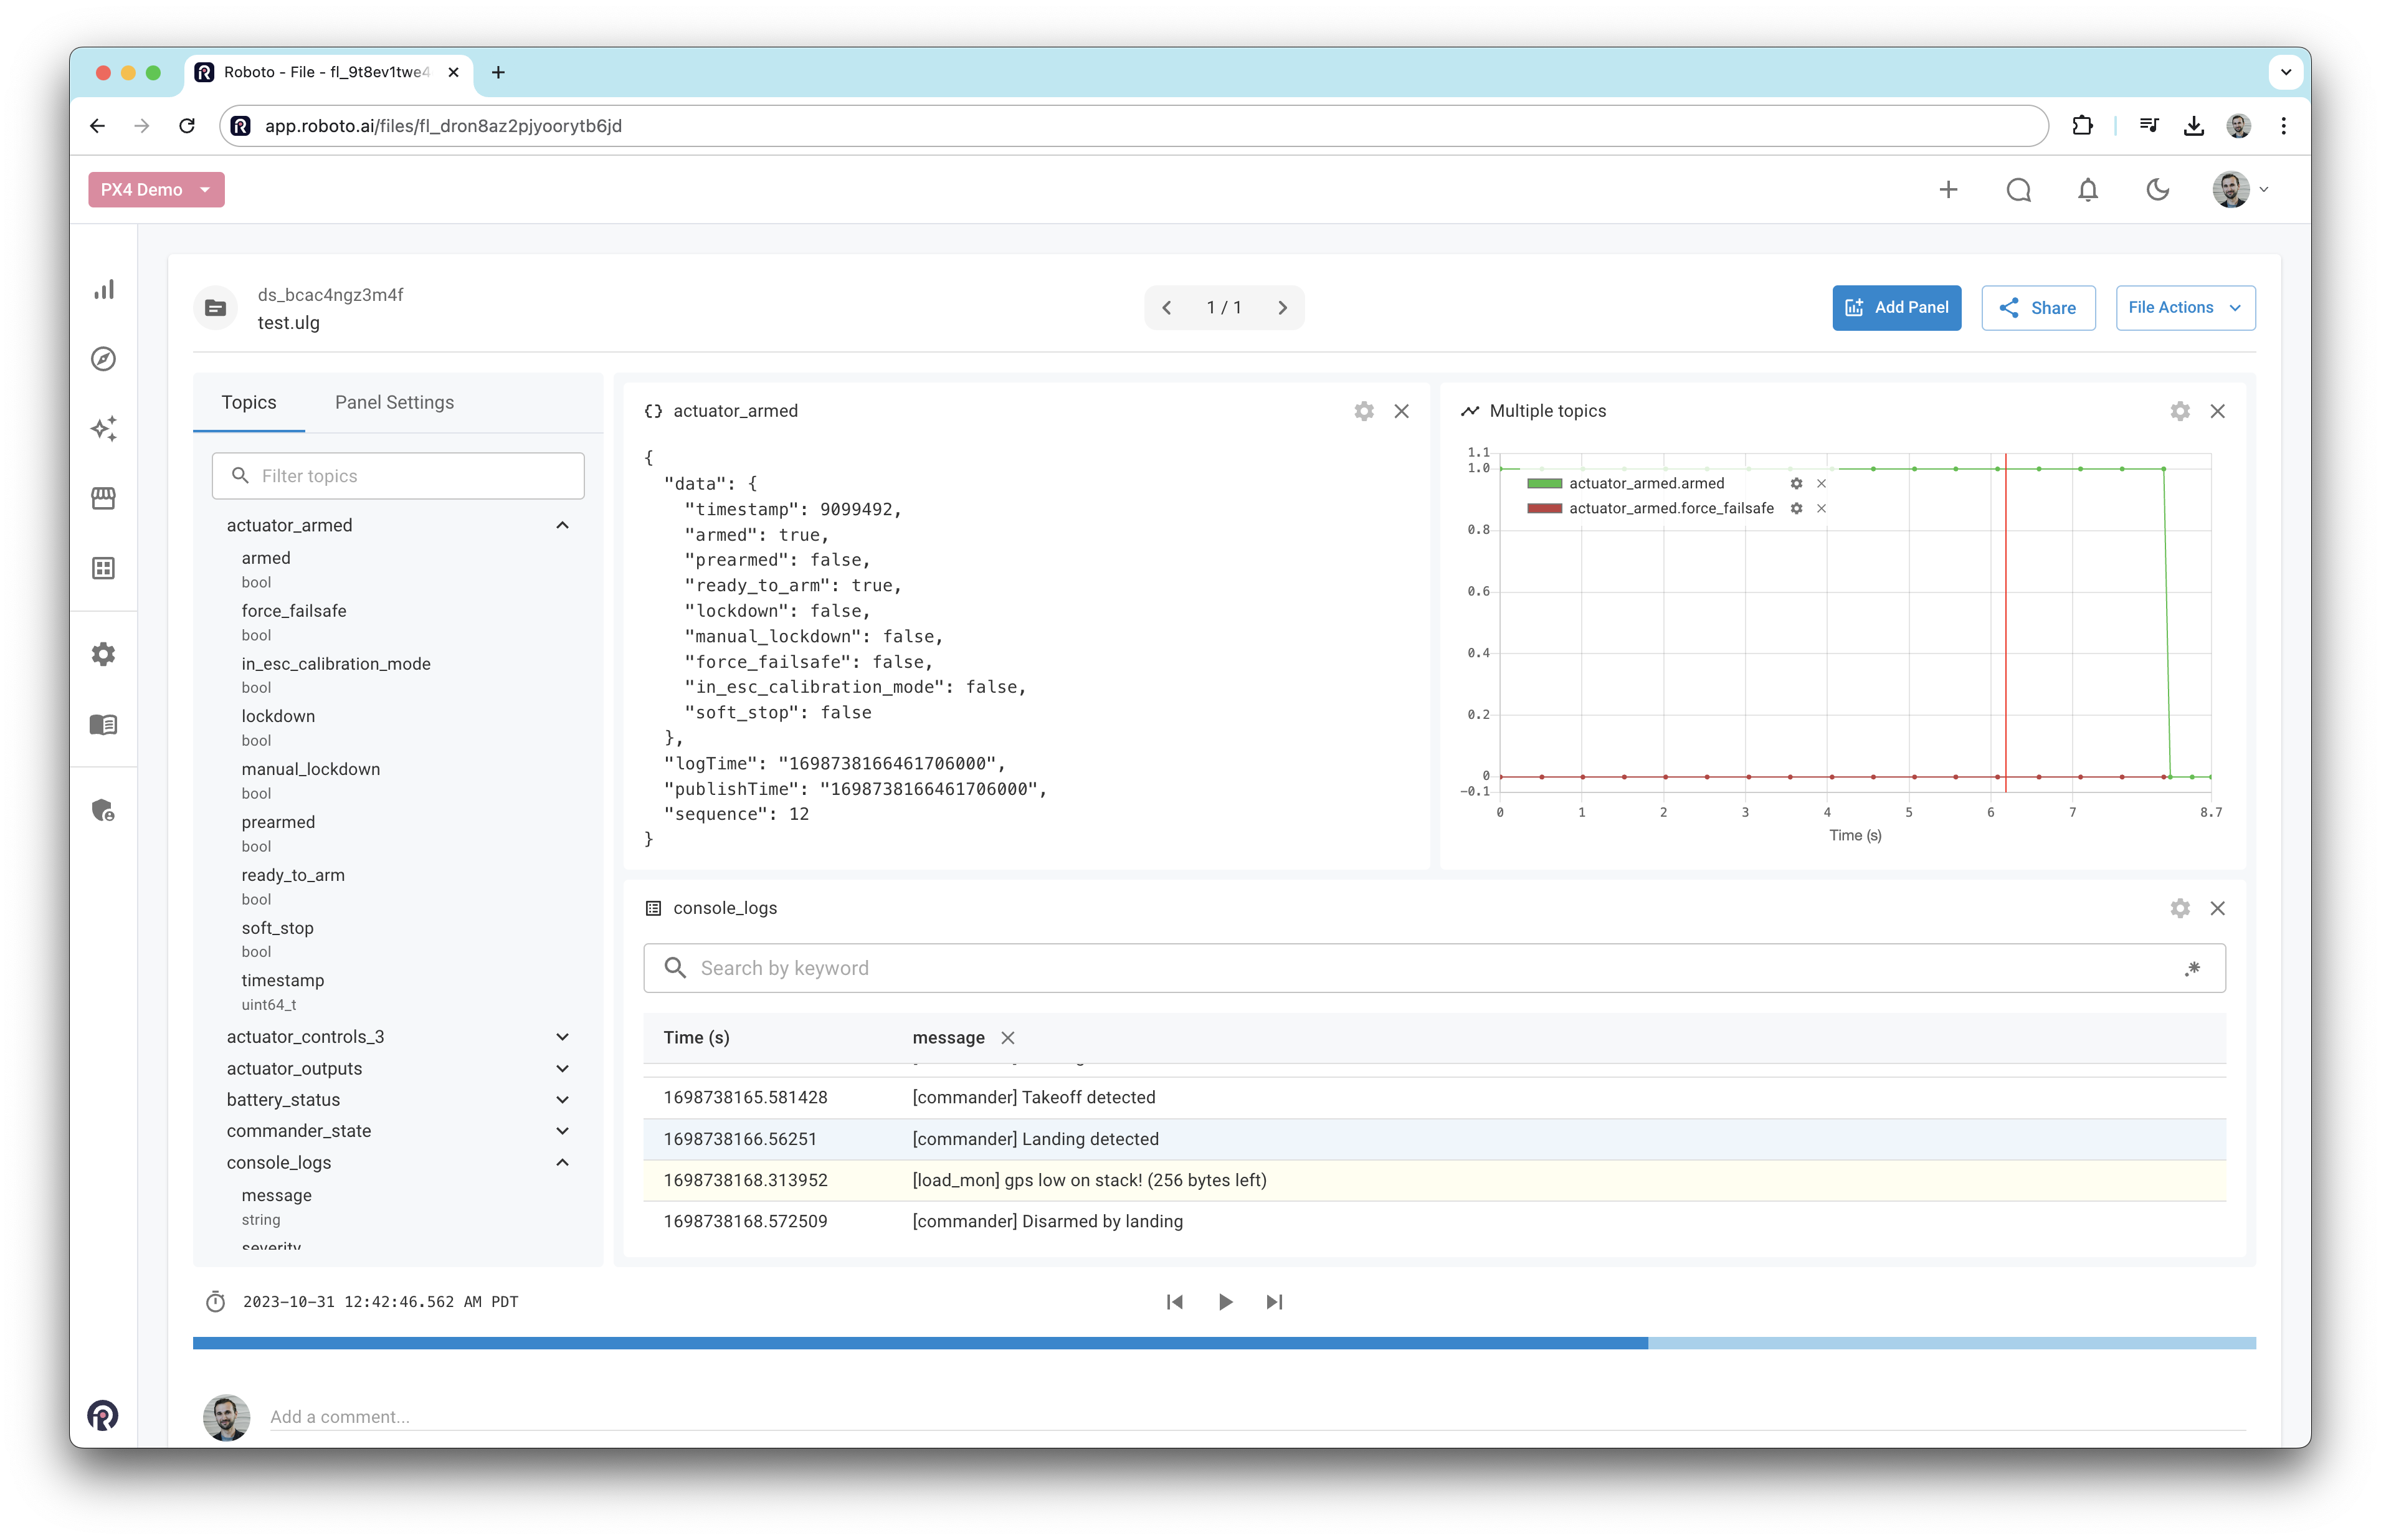
To view raw messages, right-click on a field and select View in Raw panel. This will display the raw message data in its original form.
View geographic data on map#
To view geographic data on a map, right-click on a suitable latitude or longitude field and select View in Map panel. You only need to select one of them, the corresponding coordinates will be automatically found.
Note
For PX4 logs with ver_data_format >= 2 these fields are available under the vehicle_gps_position topic and called latitude_deg and longitude_deg.
For PX4 logs with ver_data_format < 2 these fields are available under the vehicle_gps_position topic and called lat and lon.
If your flight didn’t have GPS, the vehicle_gps_position topic may not be present.
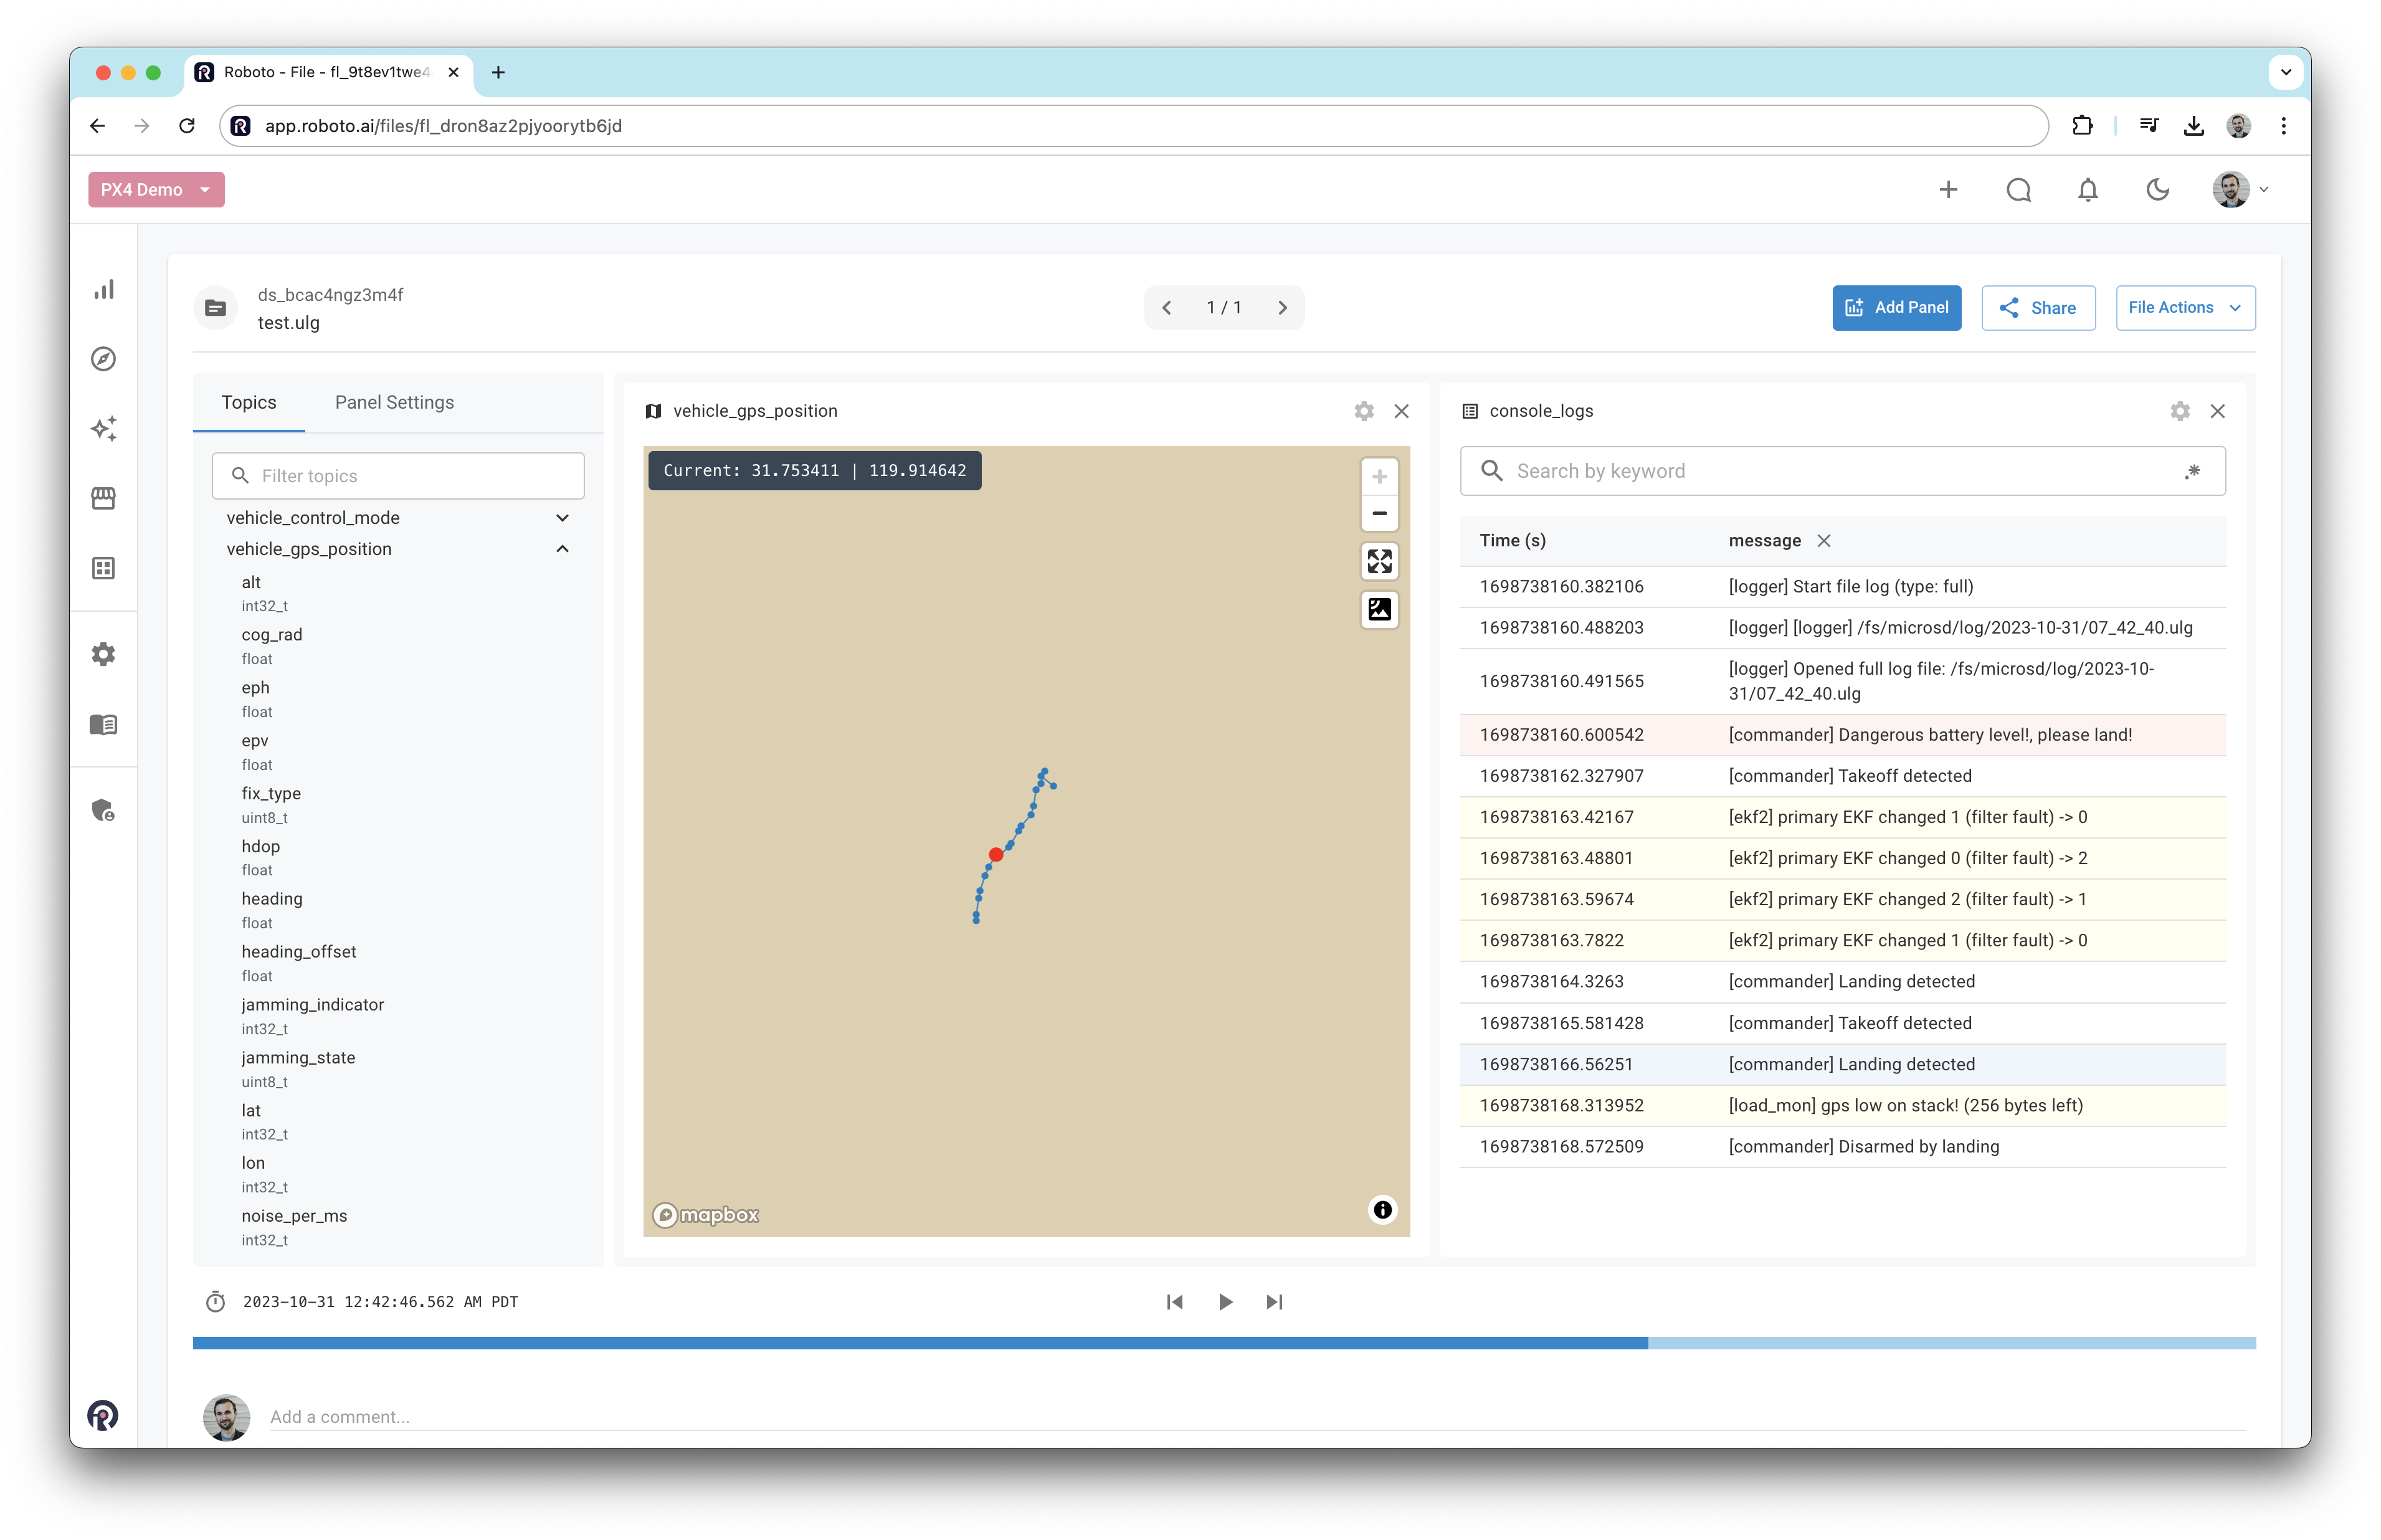
The red marker shows the closest coordinate to the current time. You can click any other blue markers to synchronize all panels to that time.
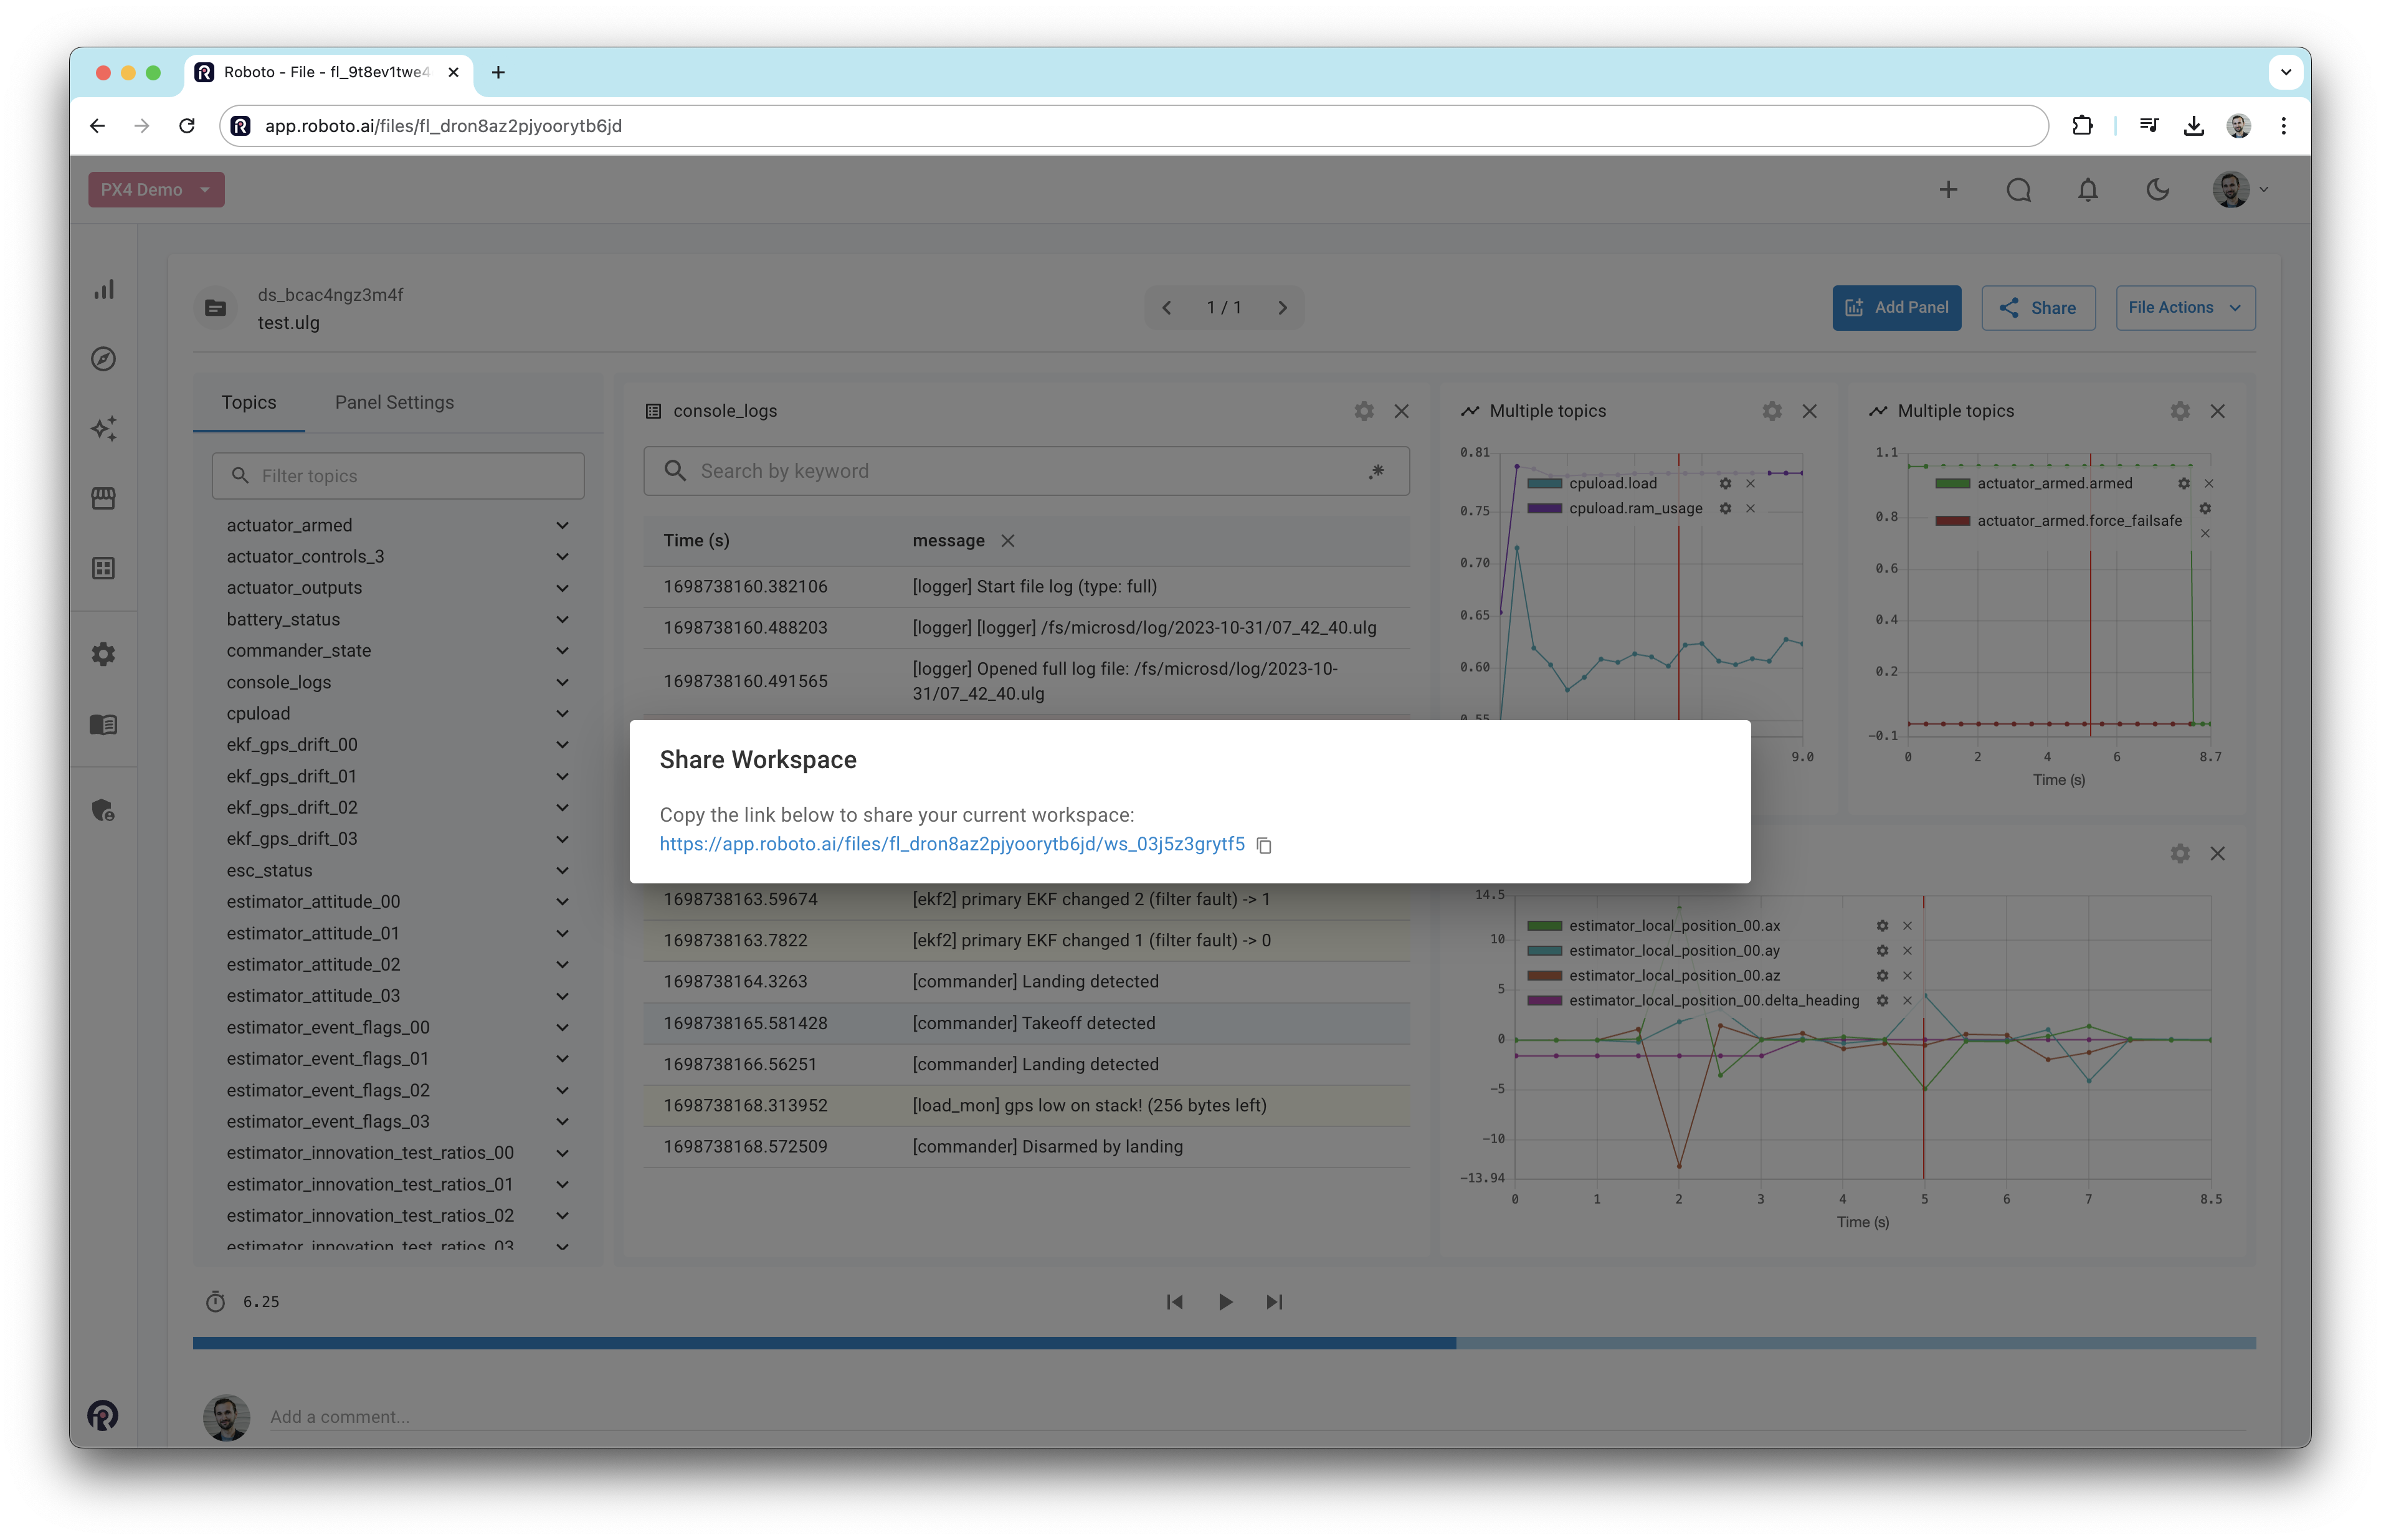
Share a workspace#
Roboto enables you to easily share workspaces with others. To do this, click on the Share button in the top right corner of the workspace. This will generate a URL that you can share with others. When they open the link, they will see the same collection of panels that you created.
Compare multiple logs#
Roboto enables you to compare several logs together in the visualizer.
Select multiple logs in a dataset’s file browser
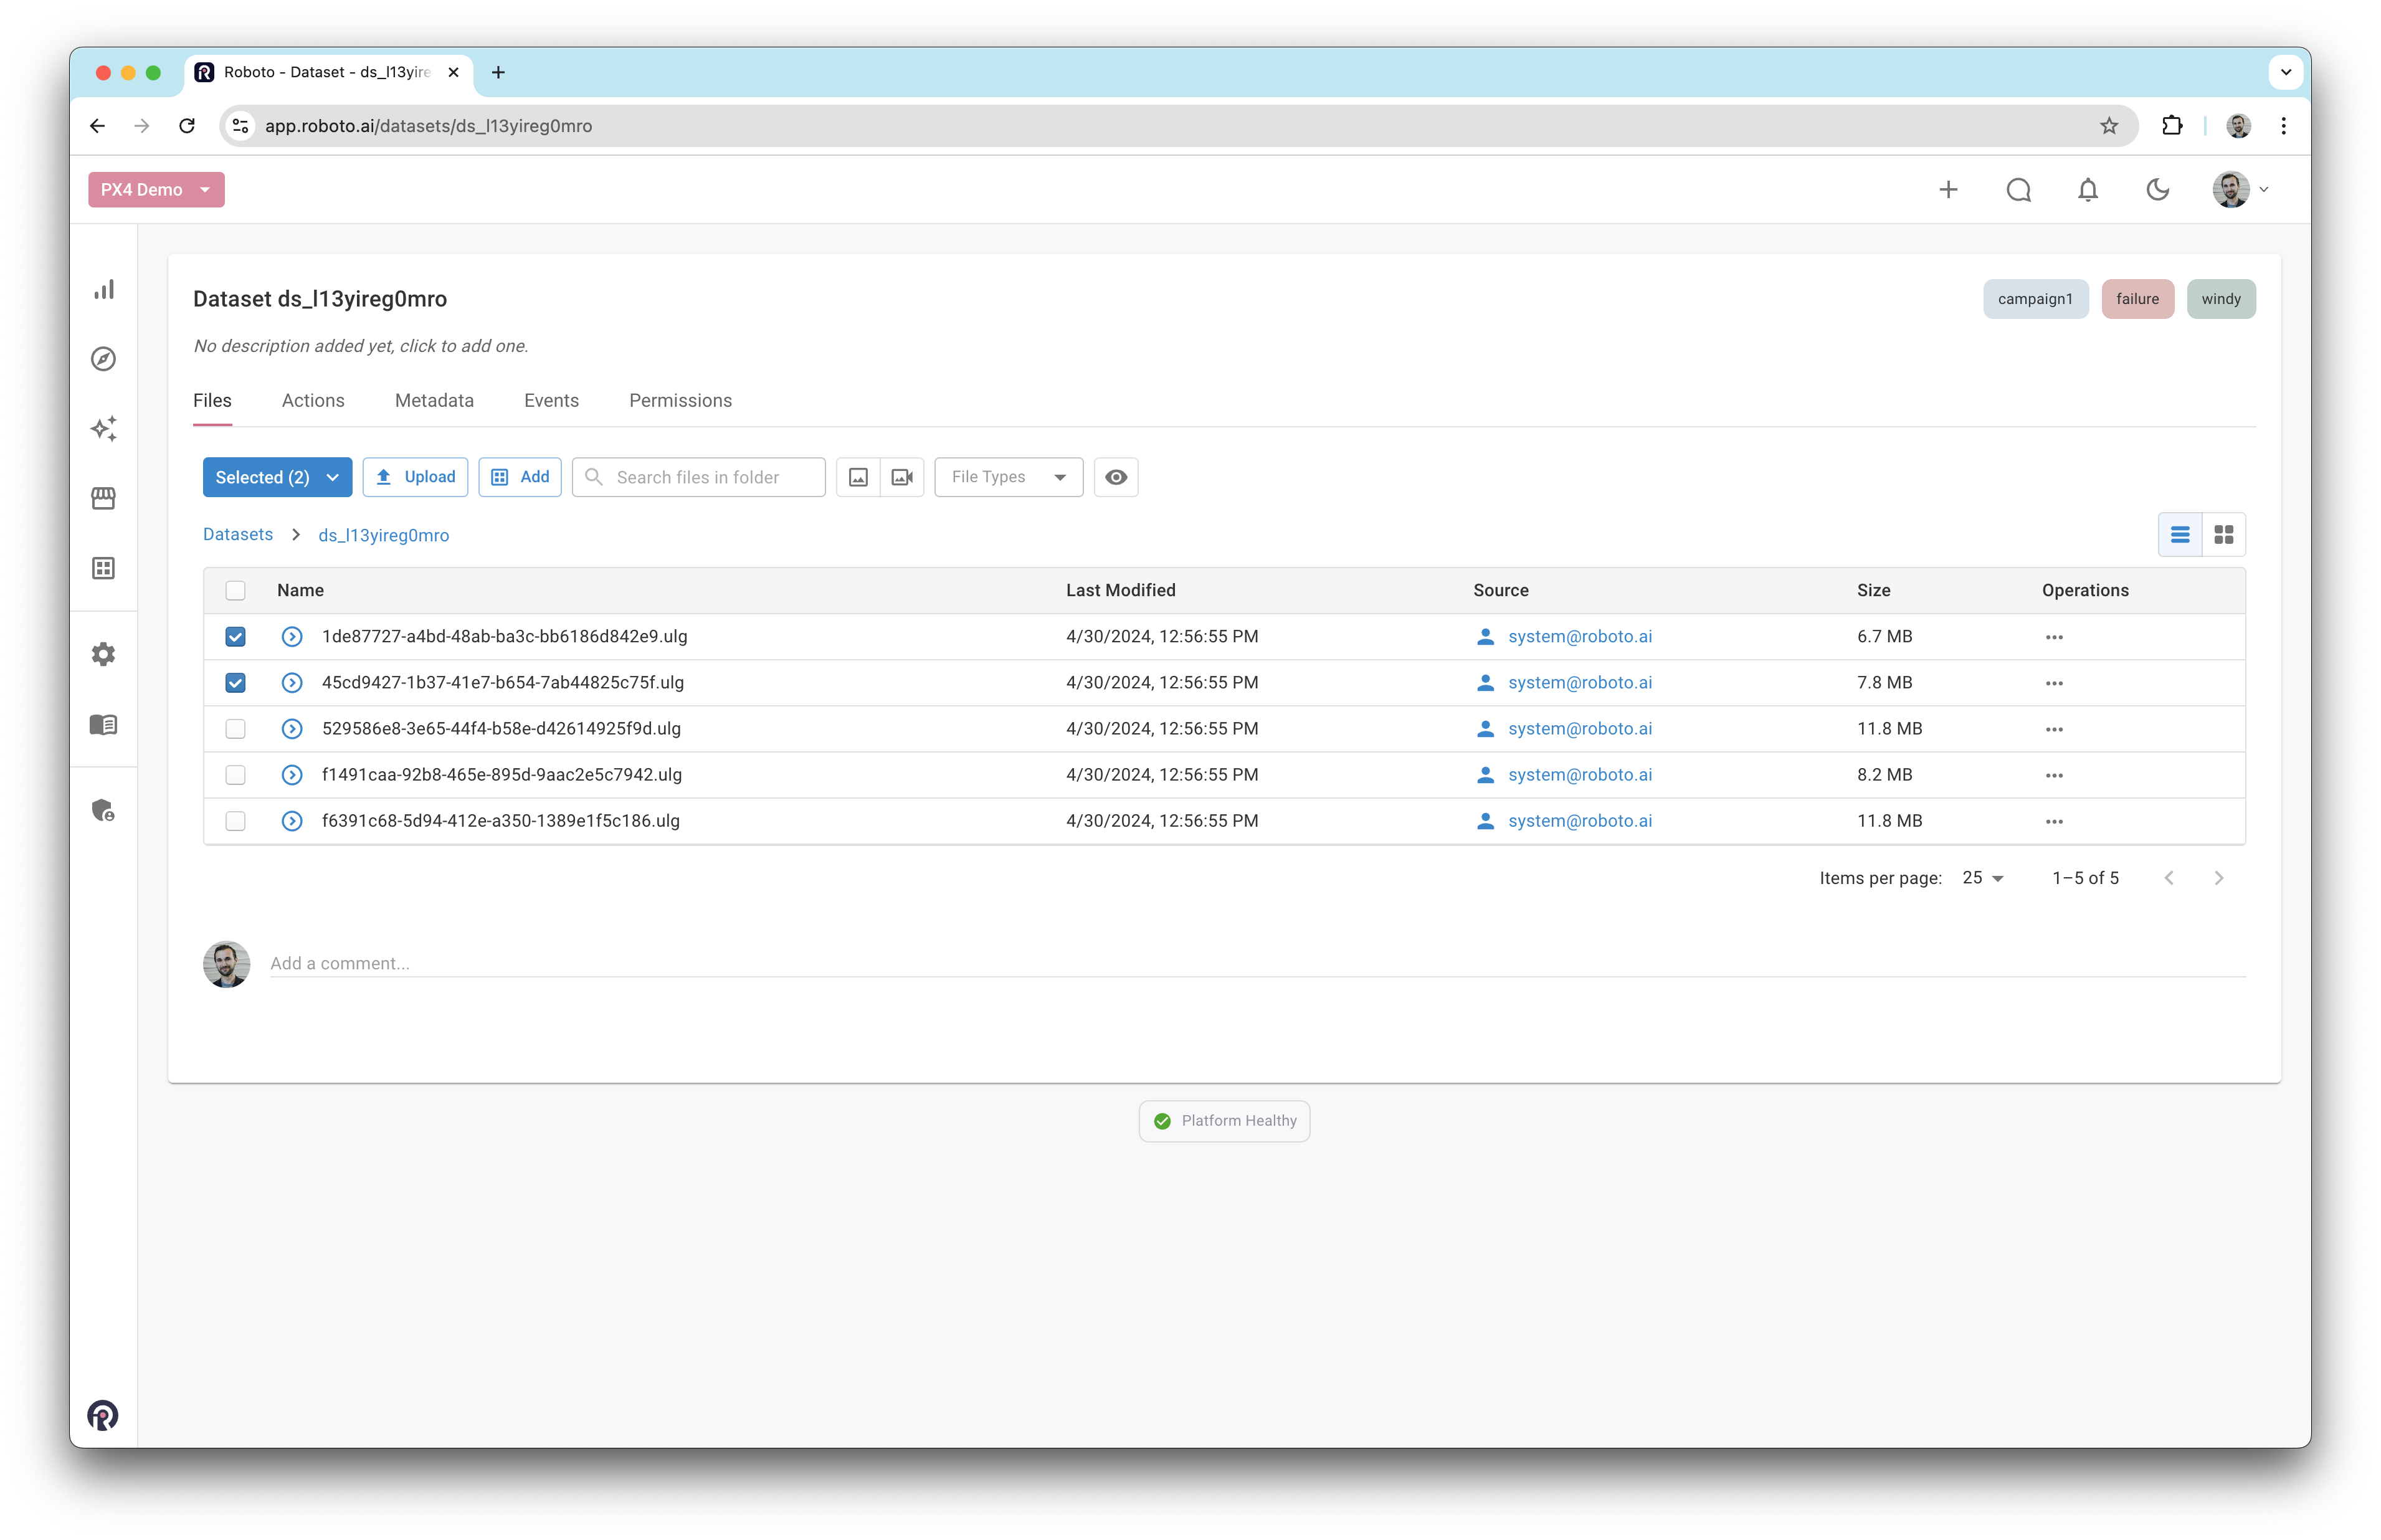
If the logs you want to visualize together are in different datasets, you can add them to a collection first.
With the logs selected, click the
Selectedbutton that appears and then clickVisualize Files
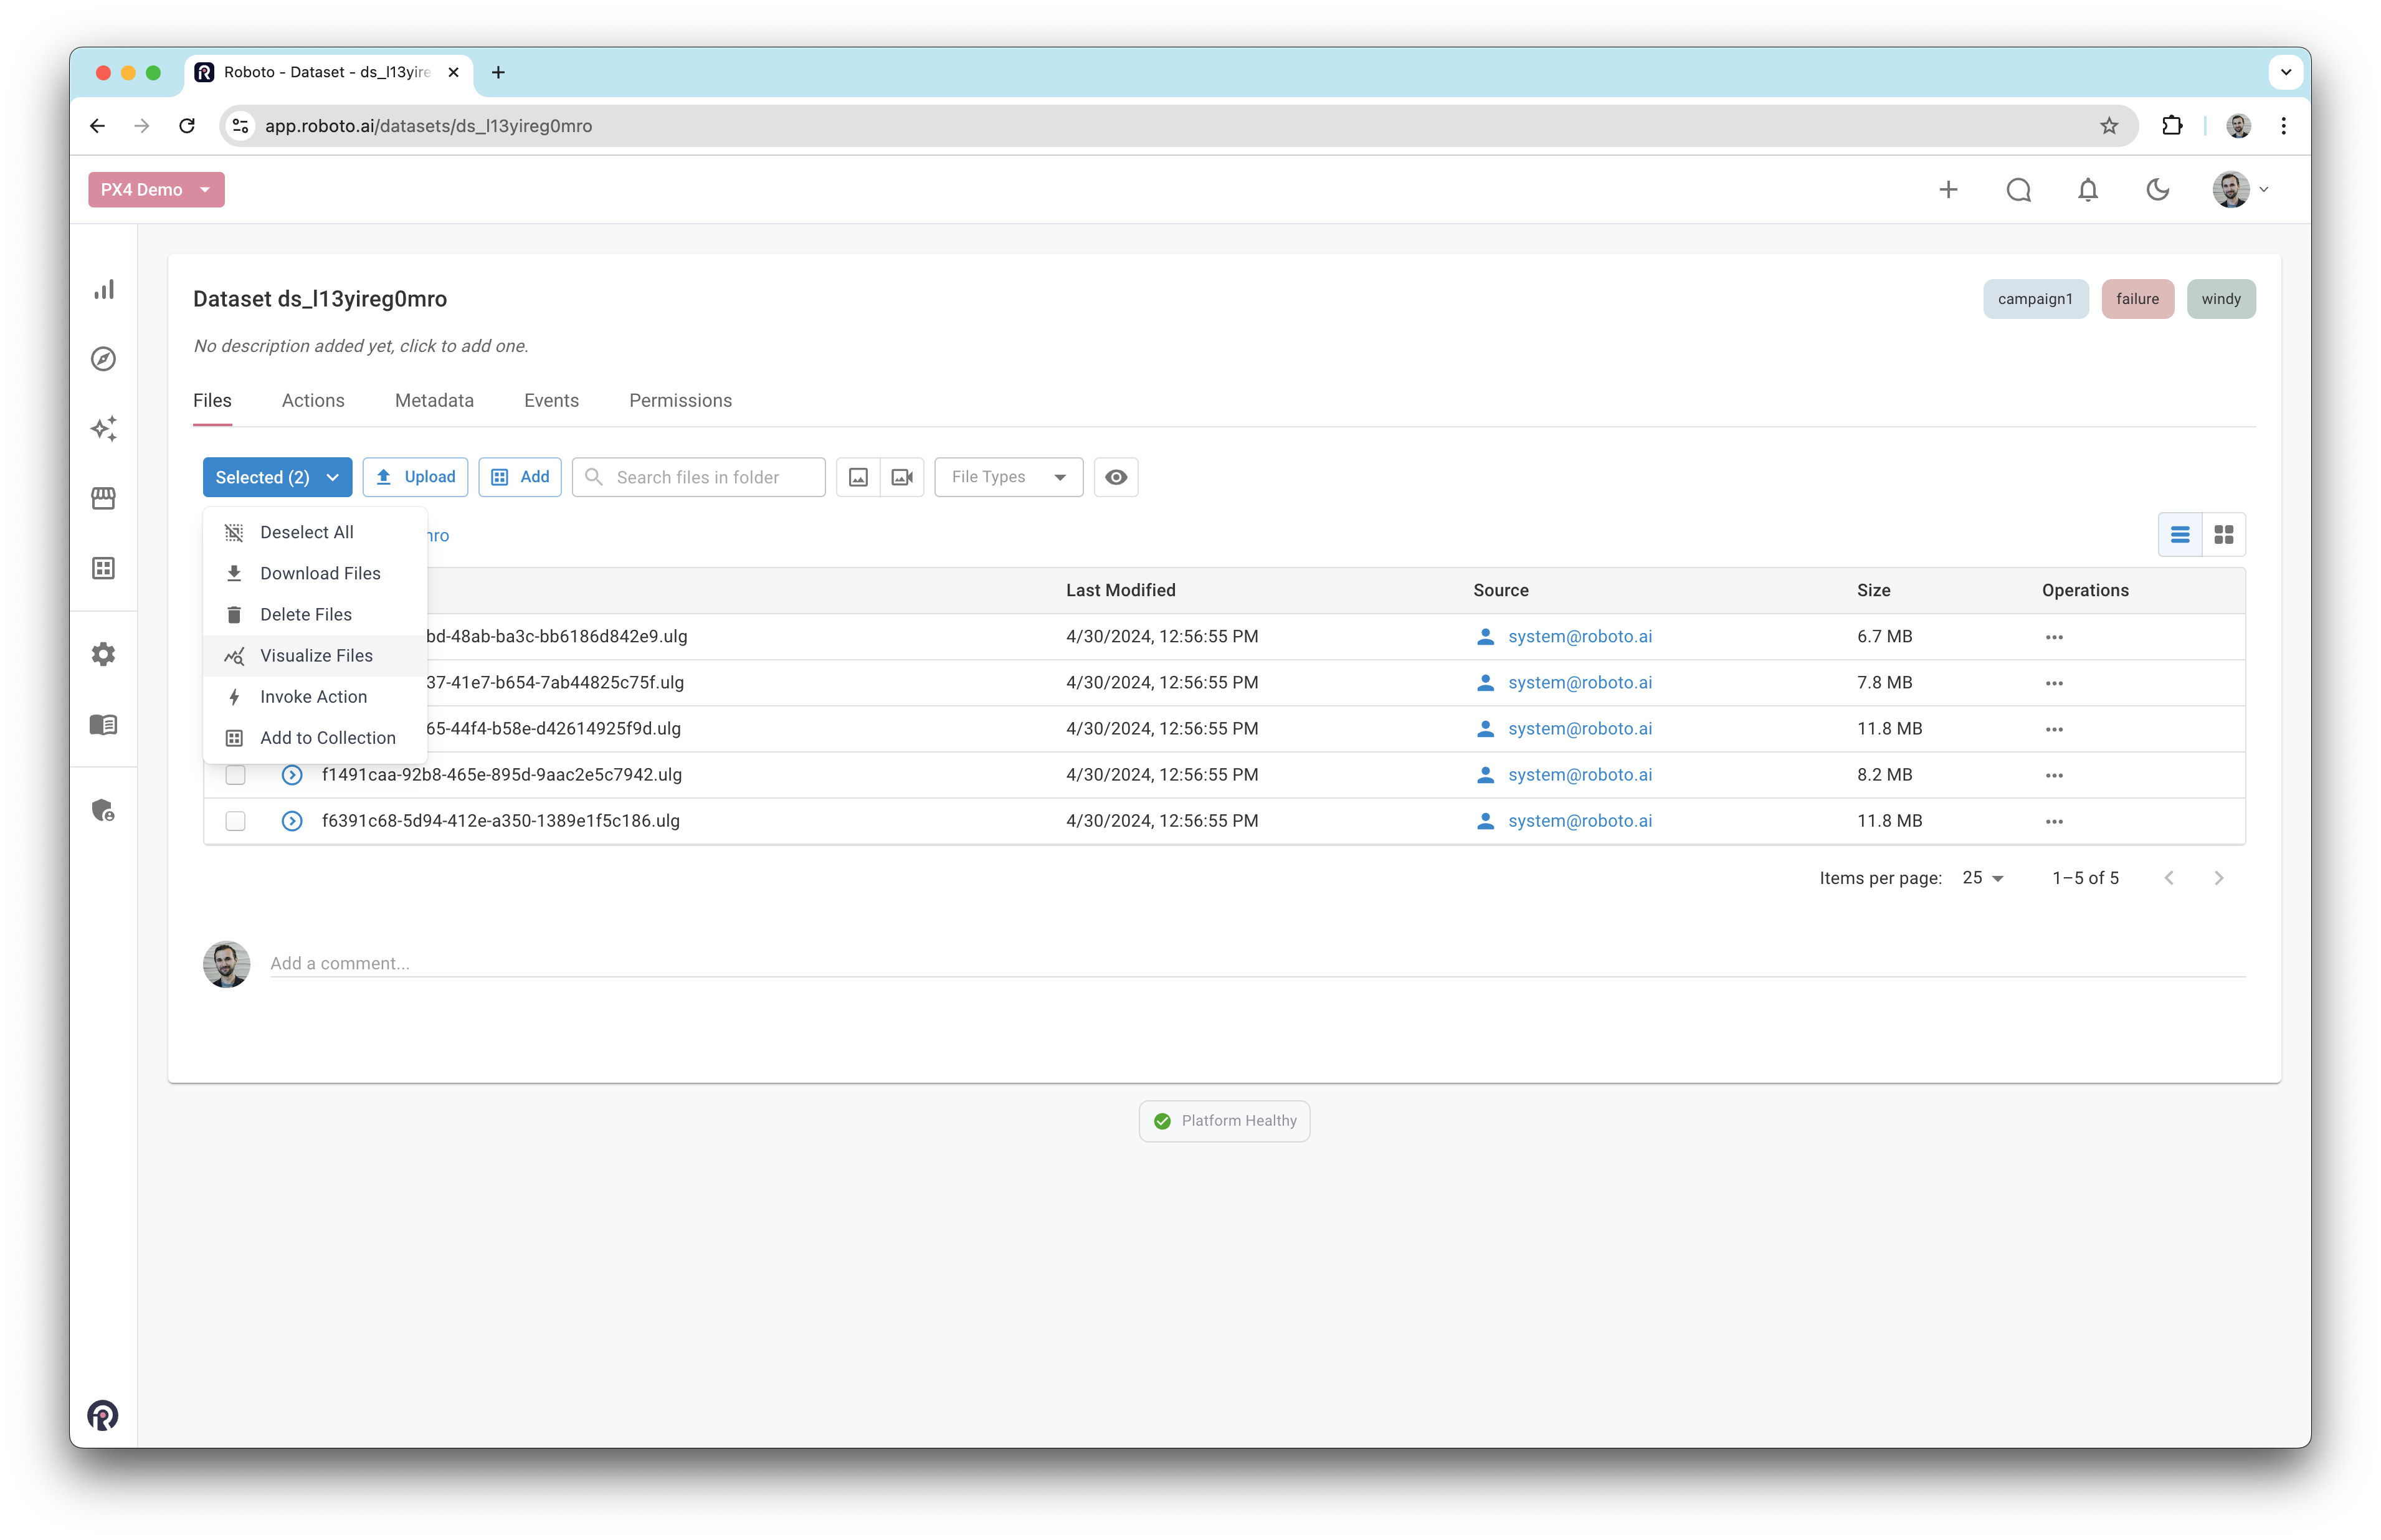
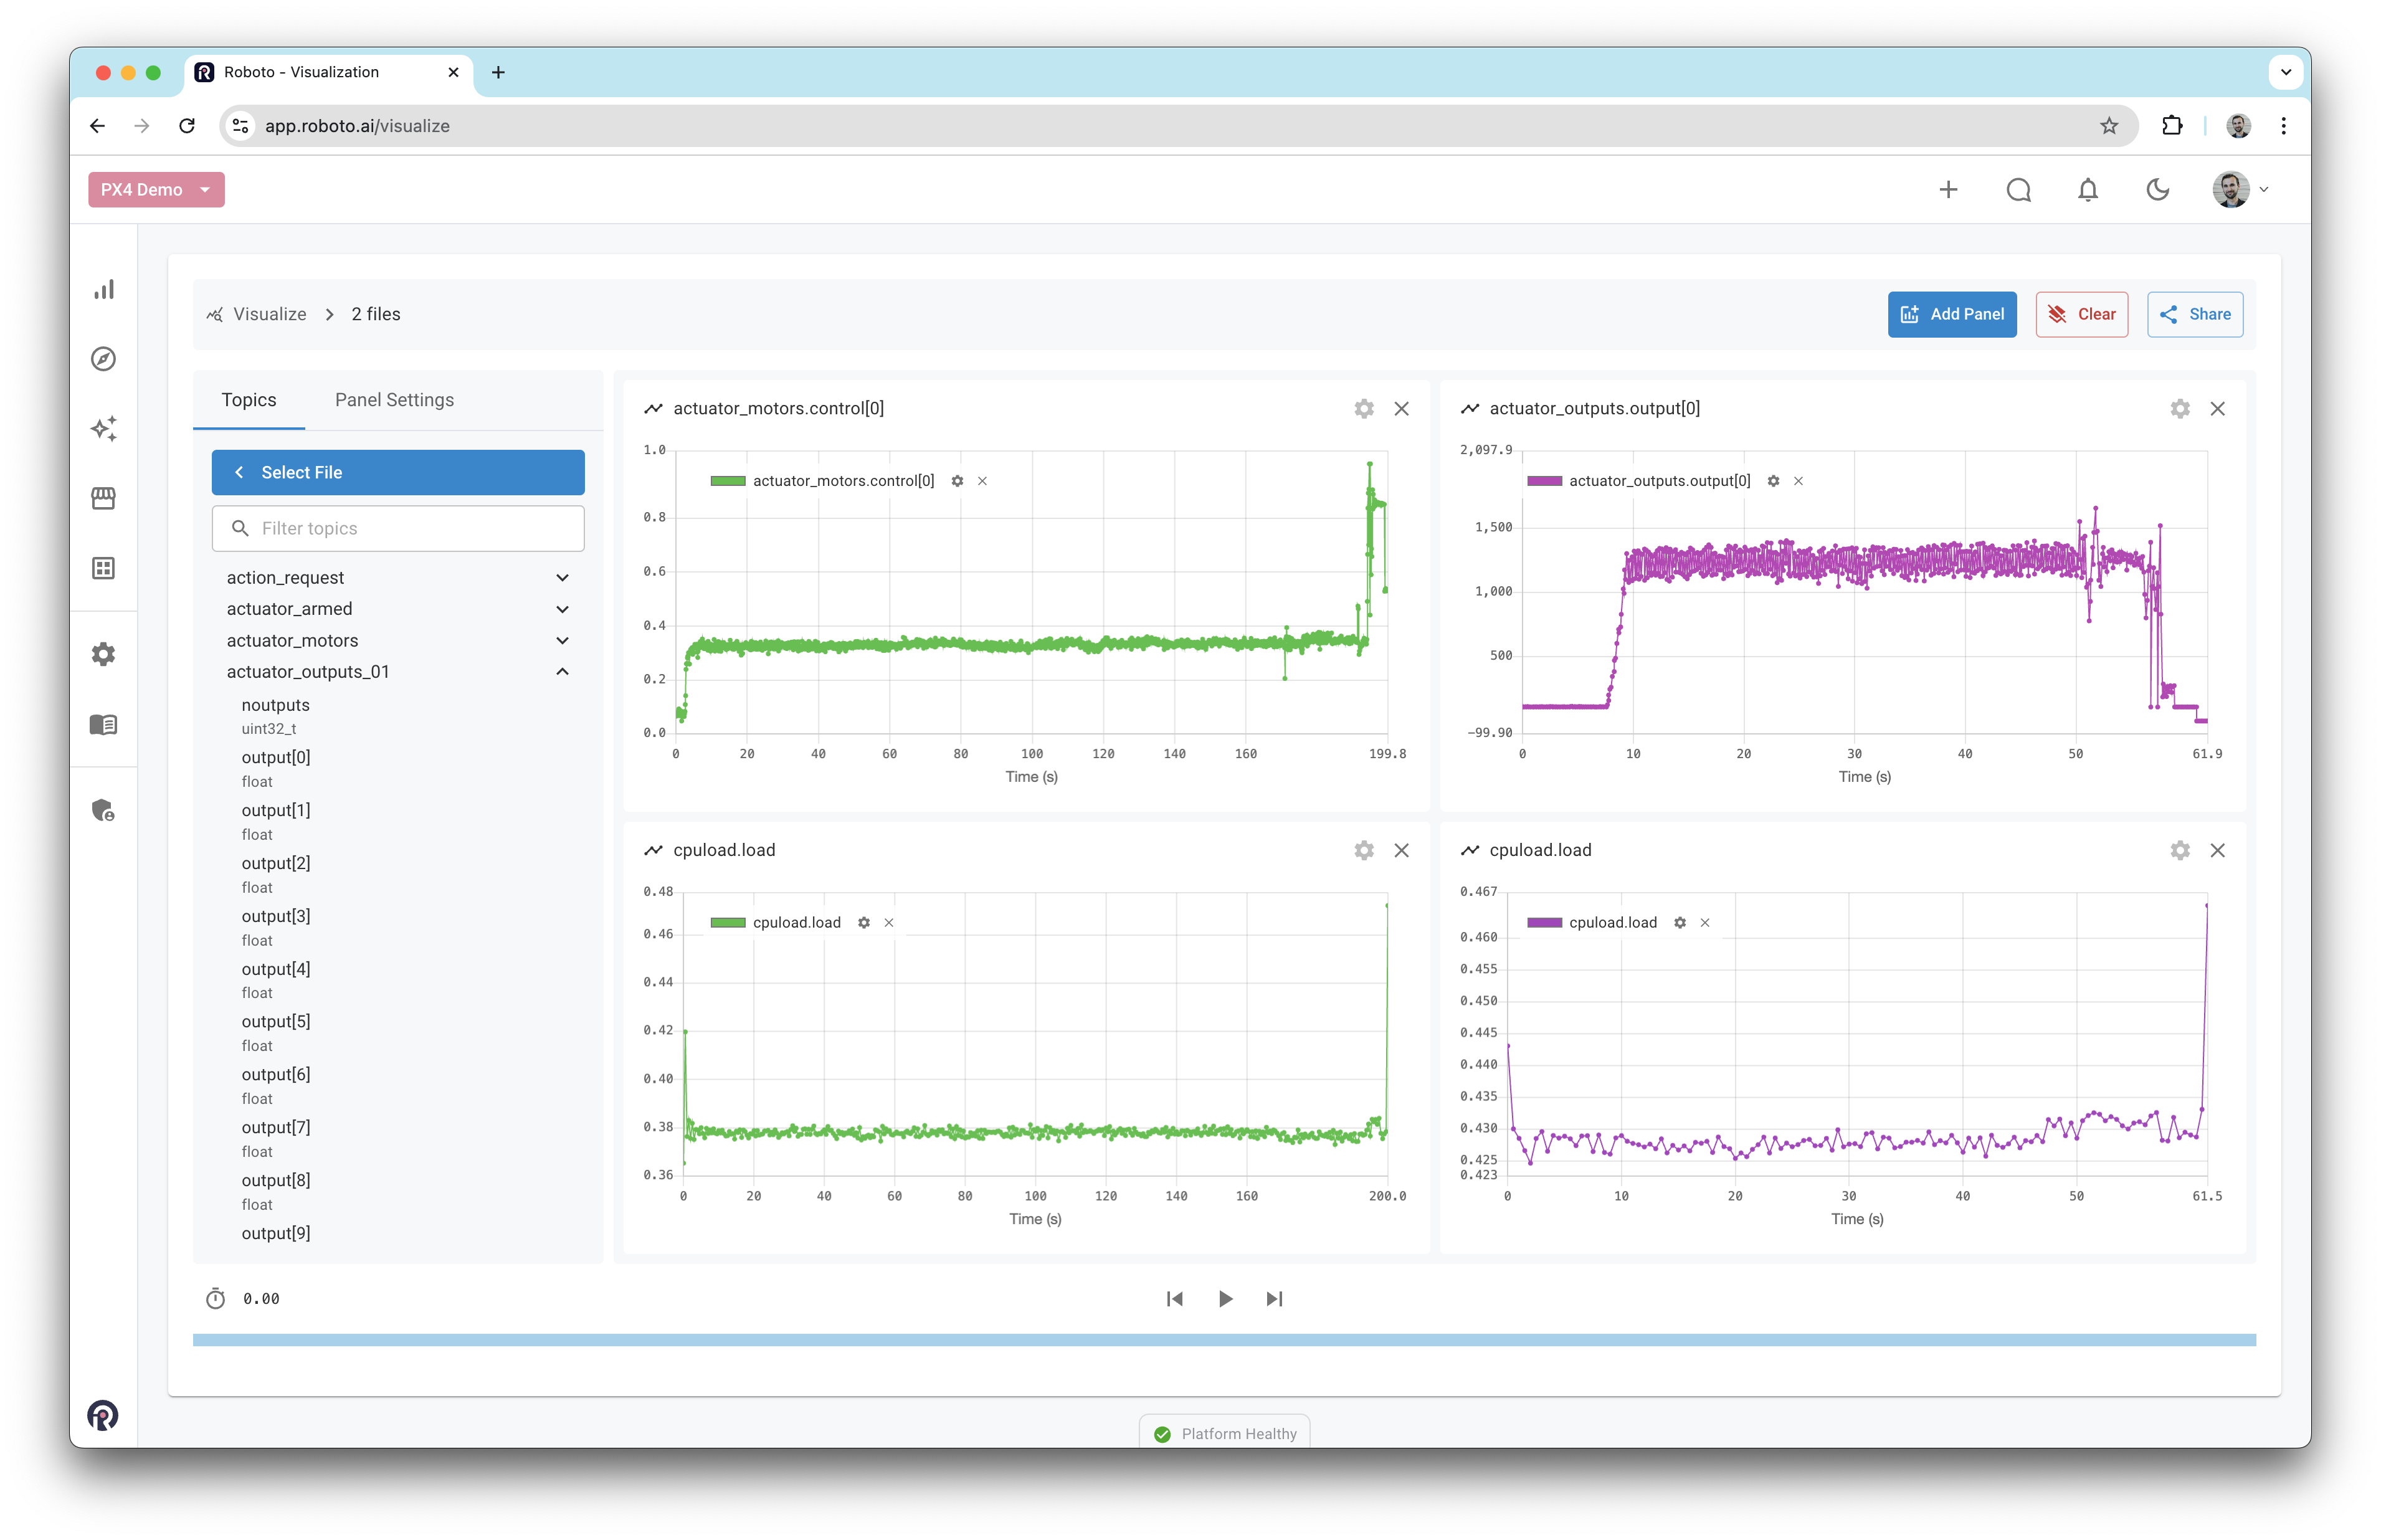
You will be taken to the visualizer with both logs listed in the left sidebar. Clicking each log reveals its associated topics.
You can then visualize data from both files in panels as before.
If your logs have GPS data, you can even compare flight paths by dragging a lat/lon topic from each file onto the Map panel
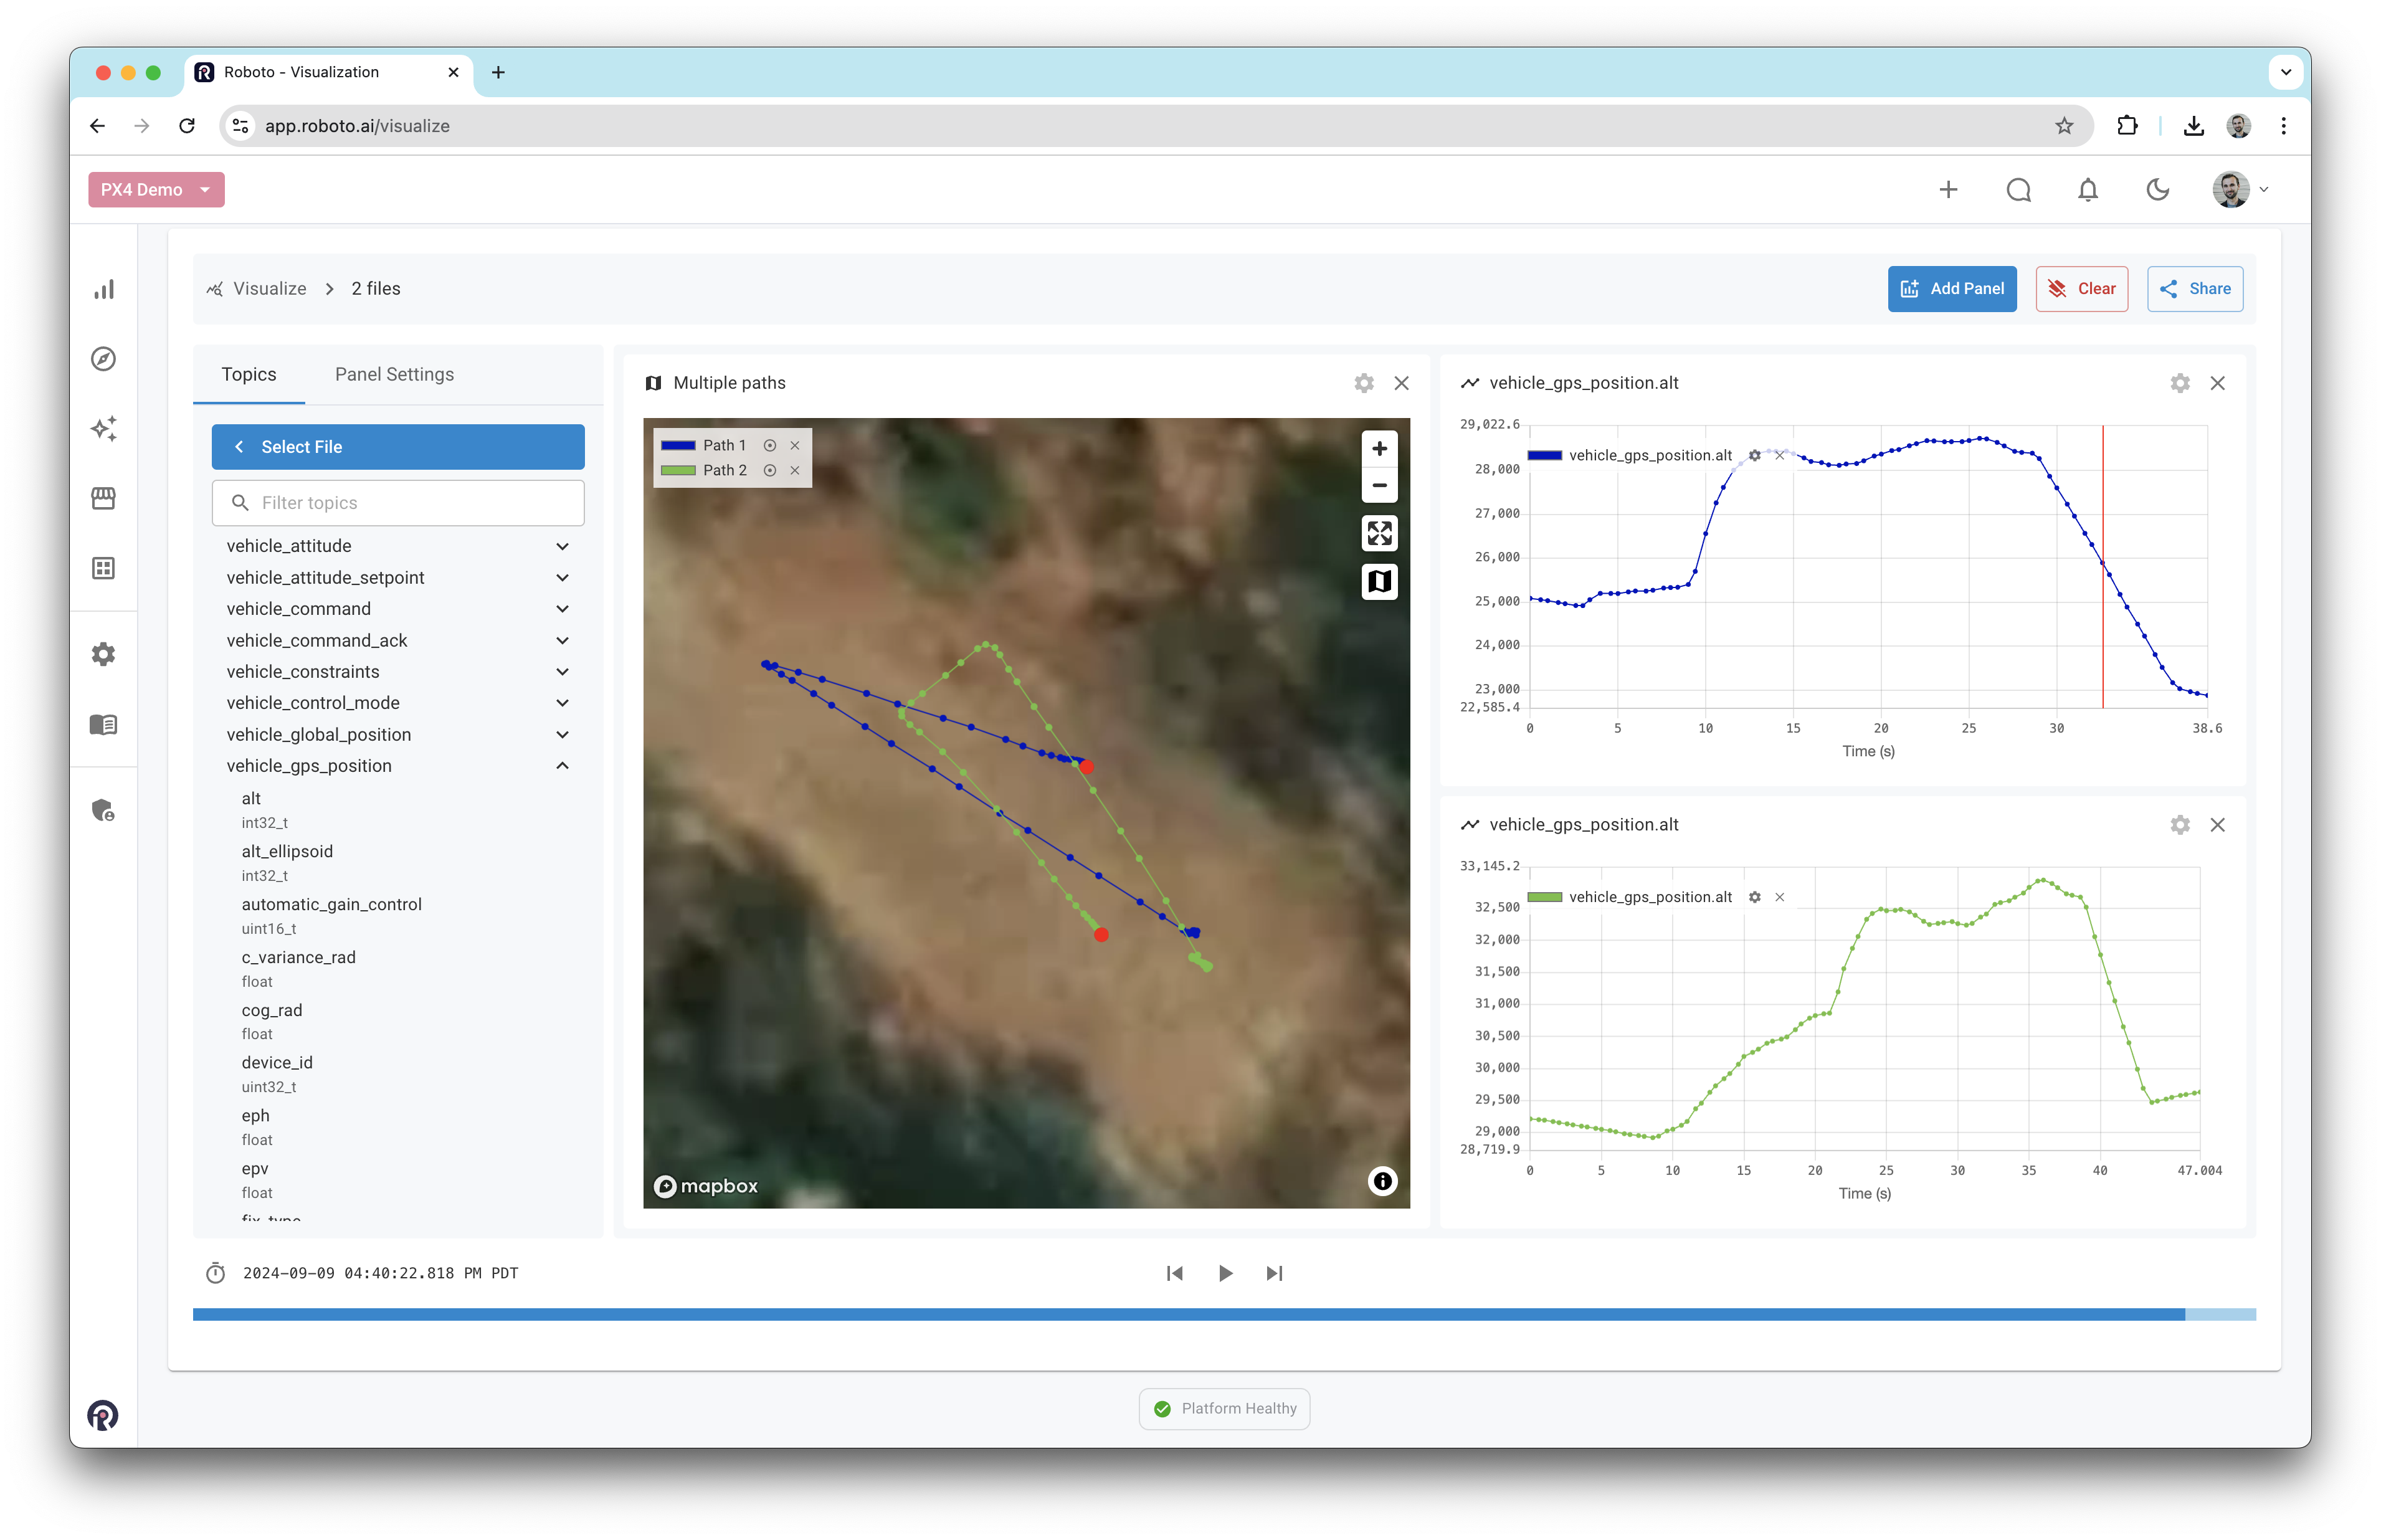
Clicking the color next to each path in the legend brings up a color picker. You can also switch between map and satellite tiles using the icons on the right of the panel.