Visualize Data#
This section provides instructions on visualizing data from ROS logs in Roboto.
Roboto supports the following types of panels for ROS data:
Plot: Display numerical time-series data on charts.
Log: Display numerical or console log data in a table.
Map: Display geographic data on a map.
Image: Display sequential image data.
Raw: Display raw message data.
Plot data#
Once a log file has been ingested, double-click it to open it in the Roboto visualizer. On the left-hand side, a list of all available topics and their fields will be displayed. To plot a field, drag it into the workspace. Alternatively, right-click on it and select View in Plot panel.
You can plot multiple fields in the same panel. Panels can be resized and moved around as needed.
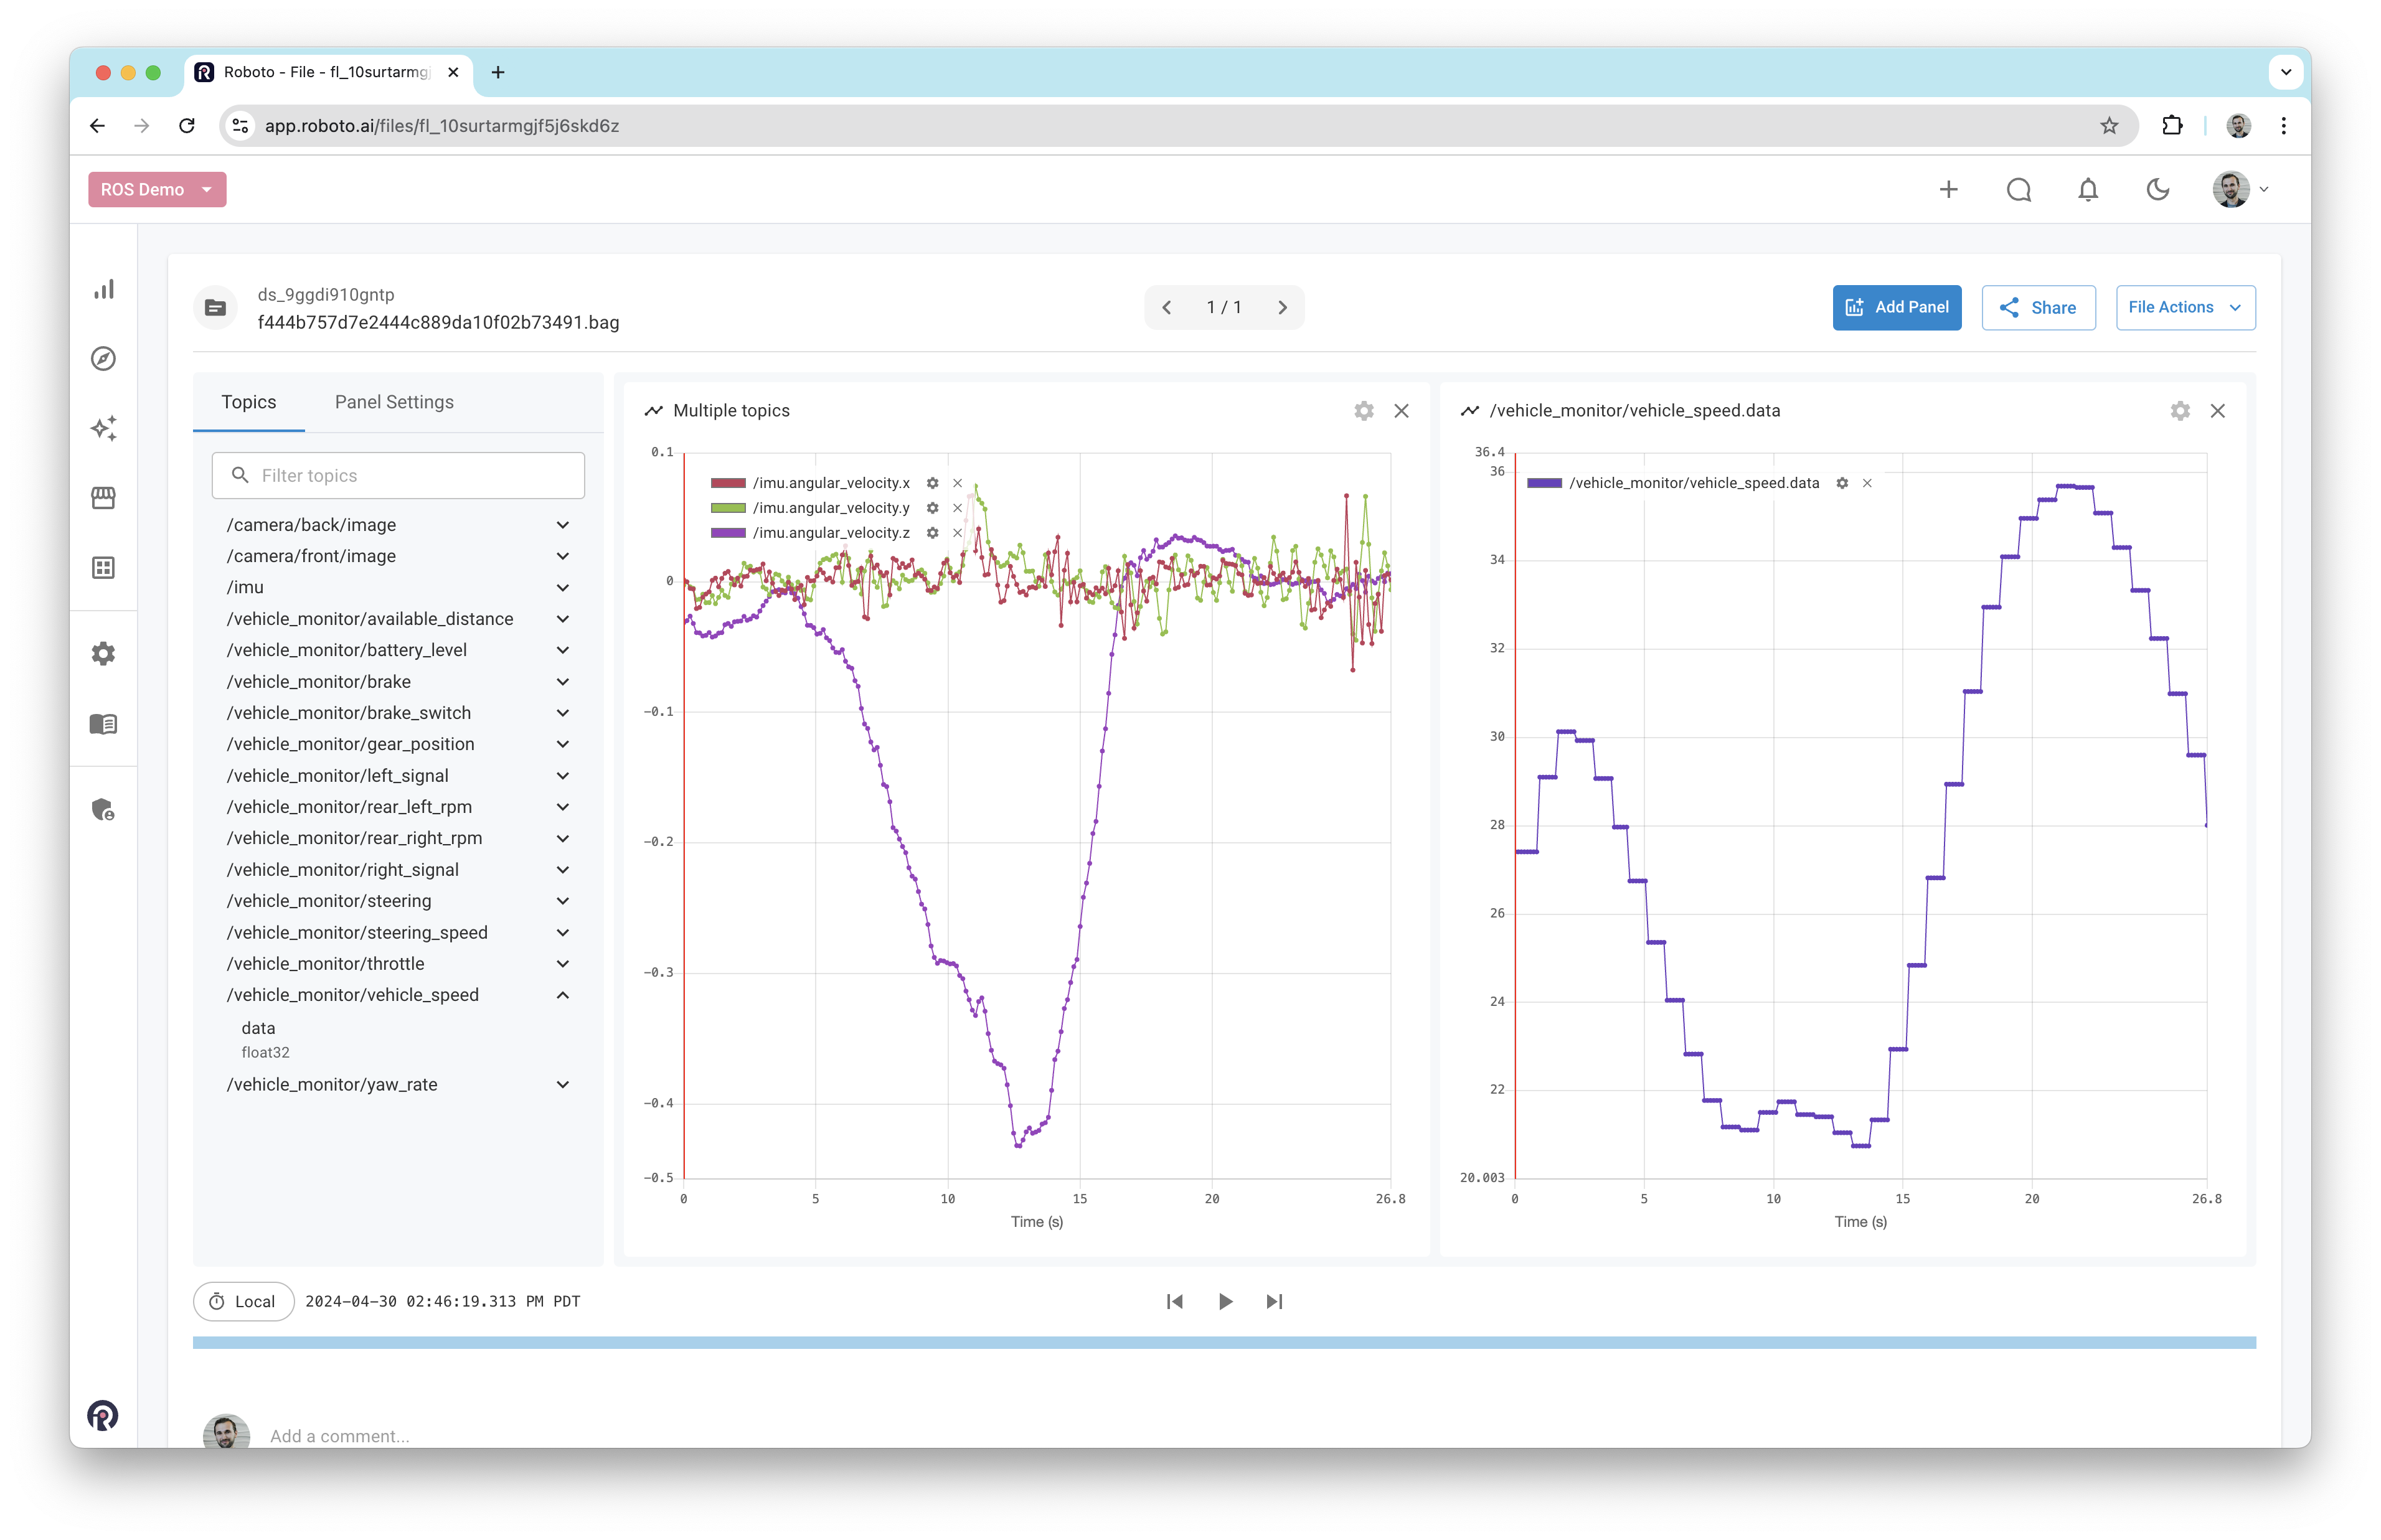
You can also create events on data using the plot panel. See the Create Events on Data user guide for more details.
View images#
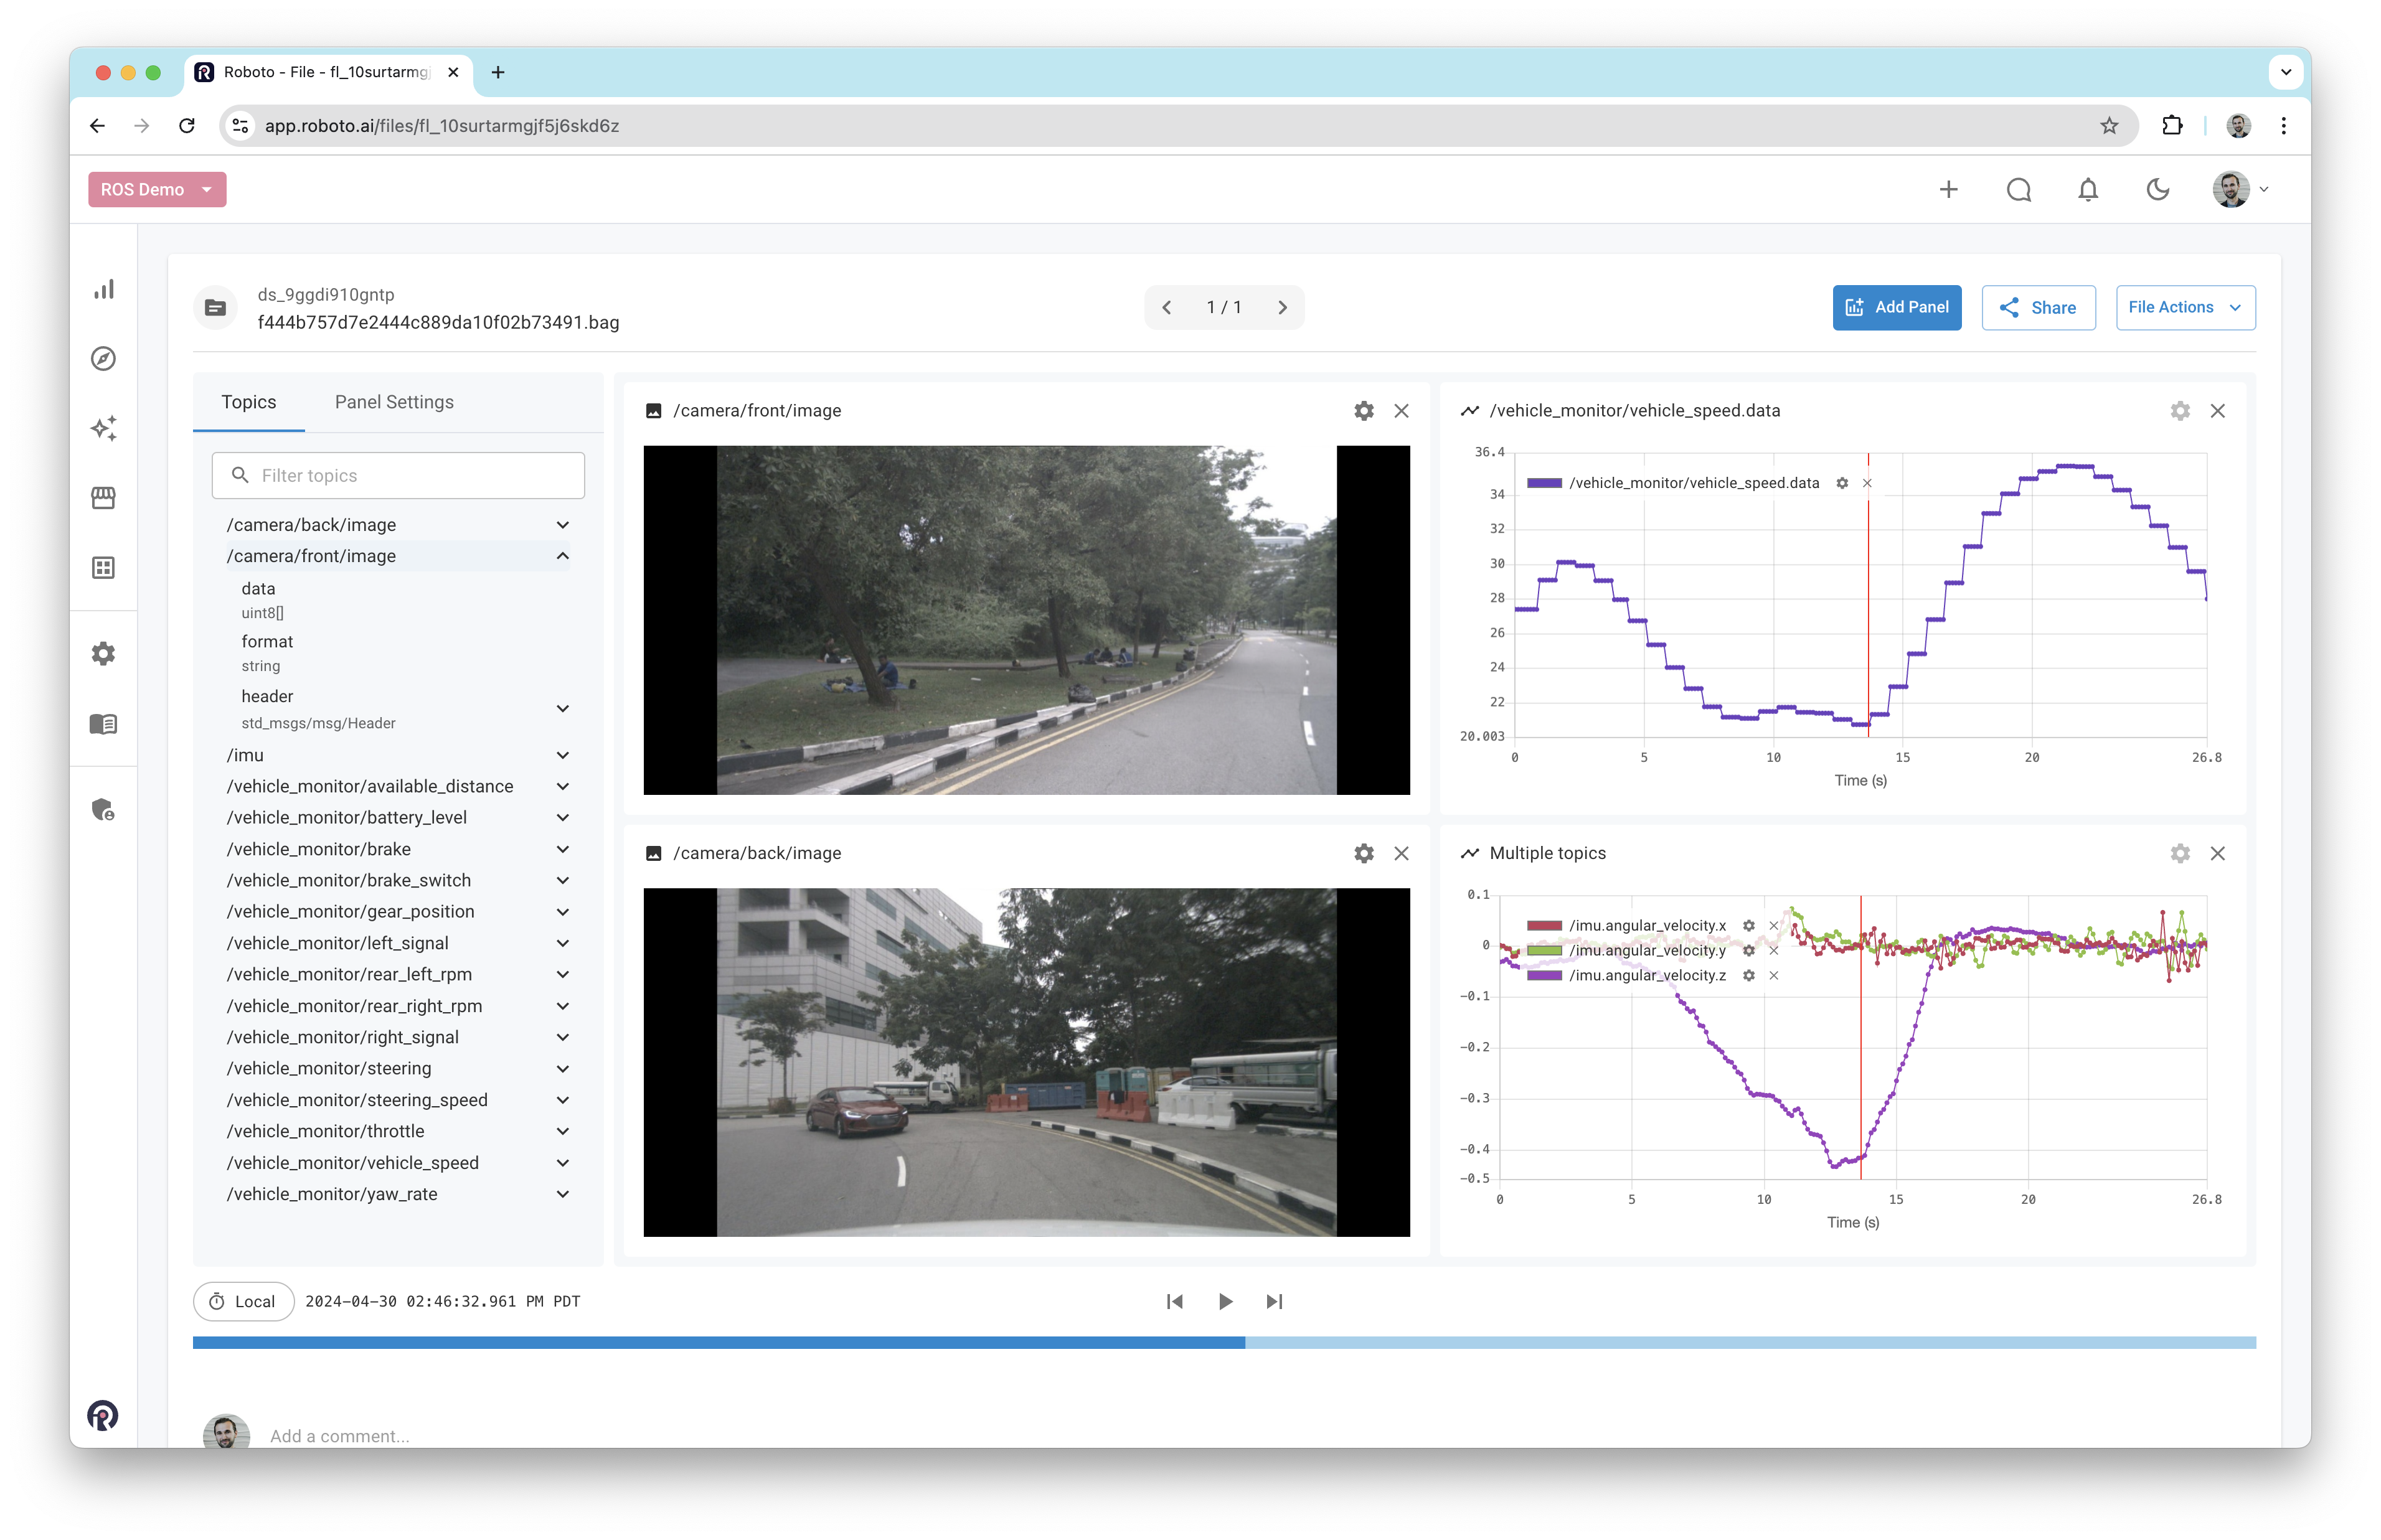
To display images, expand an image topic in the topics list. Then, right-click on data and select View in Image panel.
Clicking the play icon at the bottom of the window will play the image data back as a video. An indicator will also appear on any plot panels marking the current time.
If your images were ingested at a low resolution, you can click the settings icon on the image panel to stretch images to the panel size, and even rotate them.
View console logs#
To display ROS console logs, expand the /rosout topic in the topics list. Then, right-click on msg and select View in Log panel.
You can also search for keywords within the console log panel, and toggle regex mode too. Clicking on a row in the panel will synchronize all other panels to the corresponding point in time.
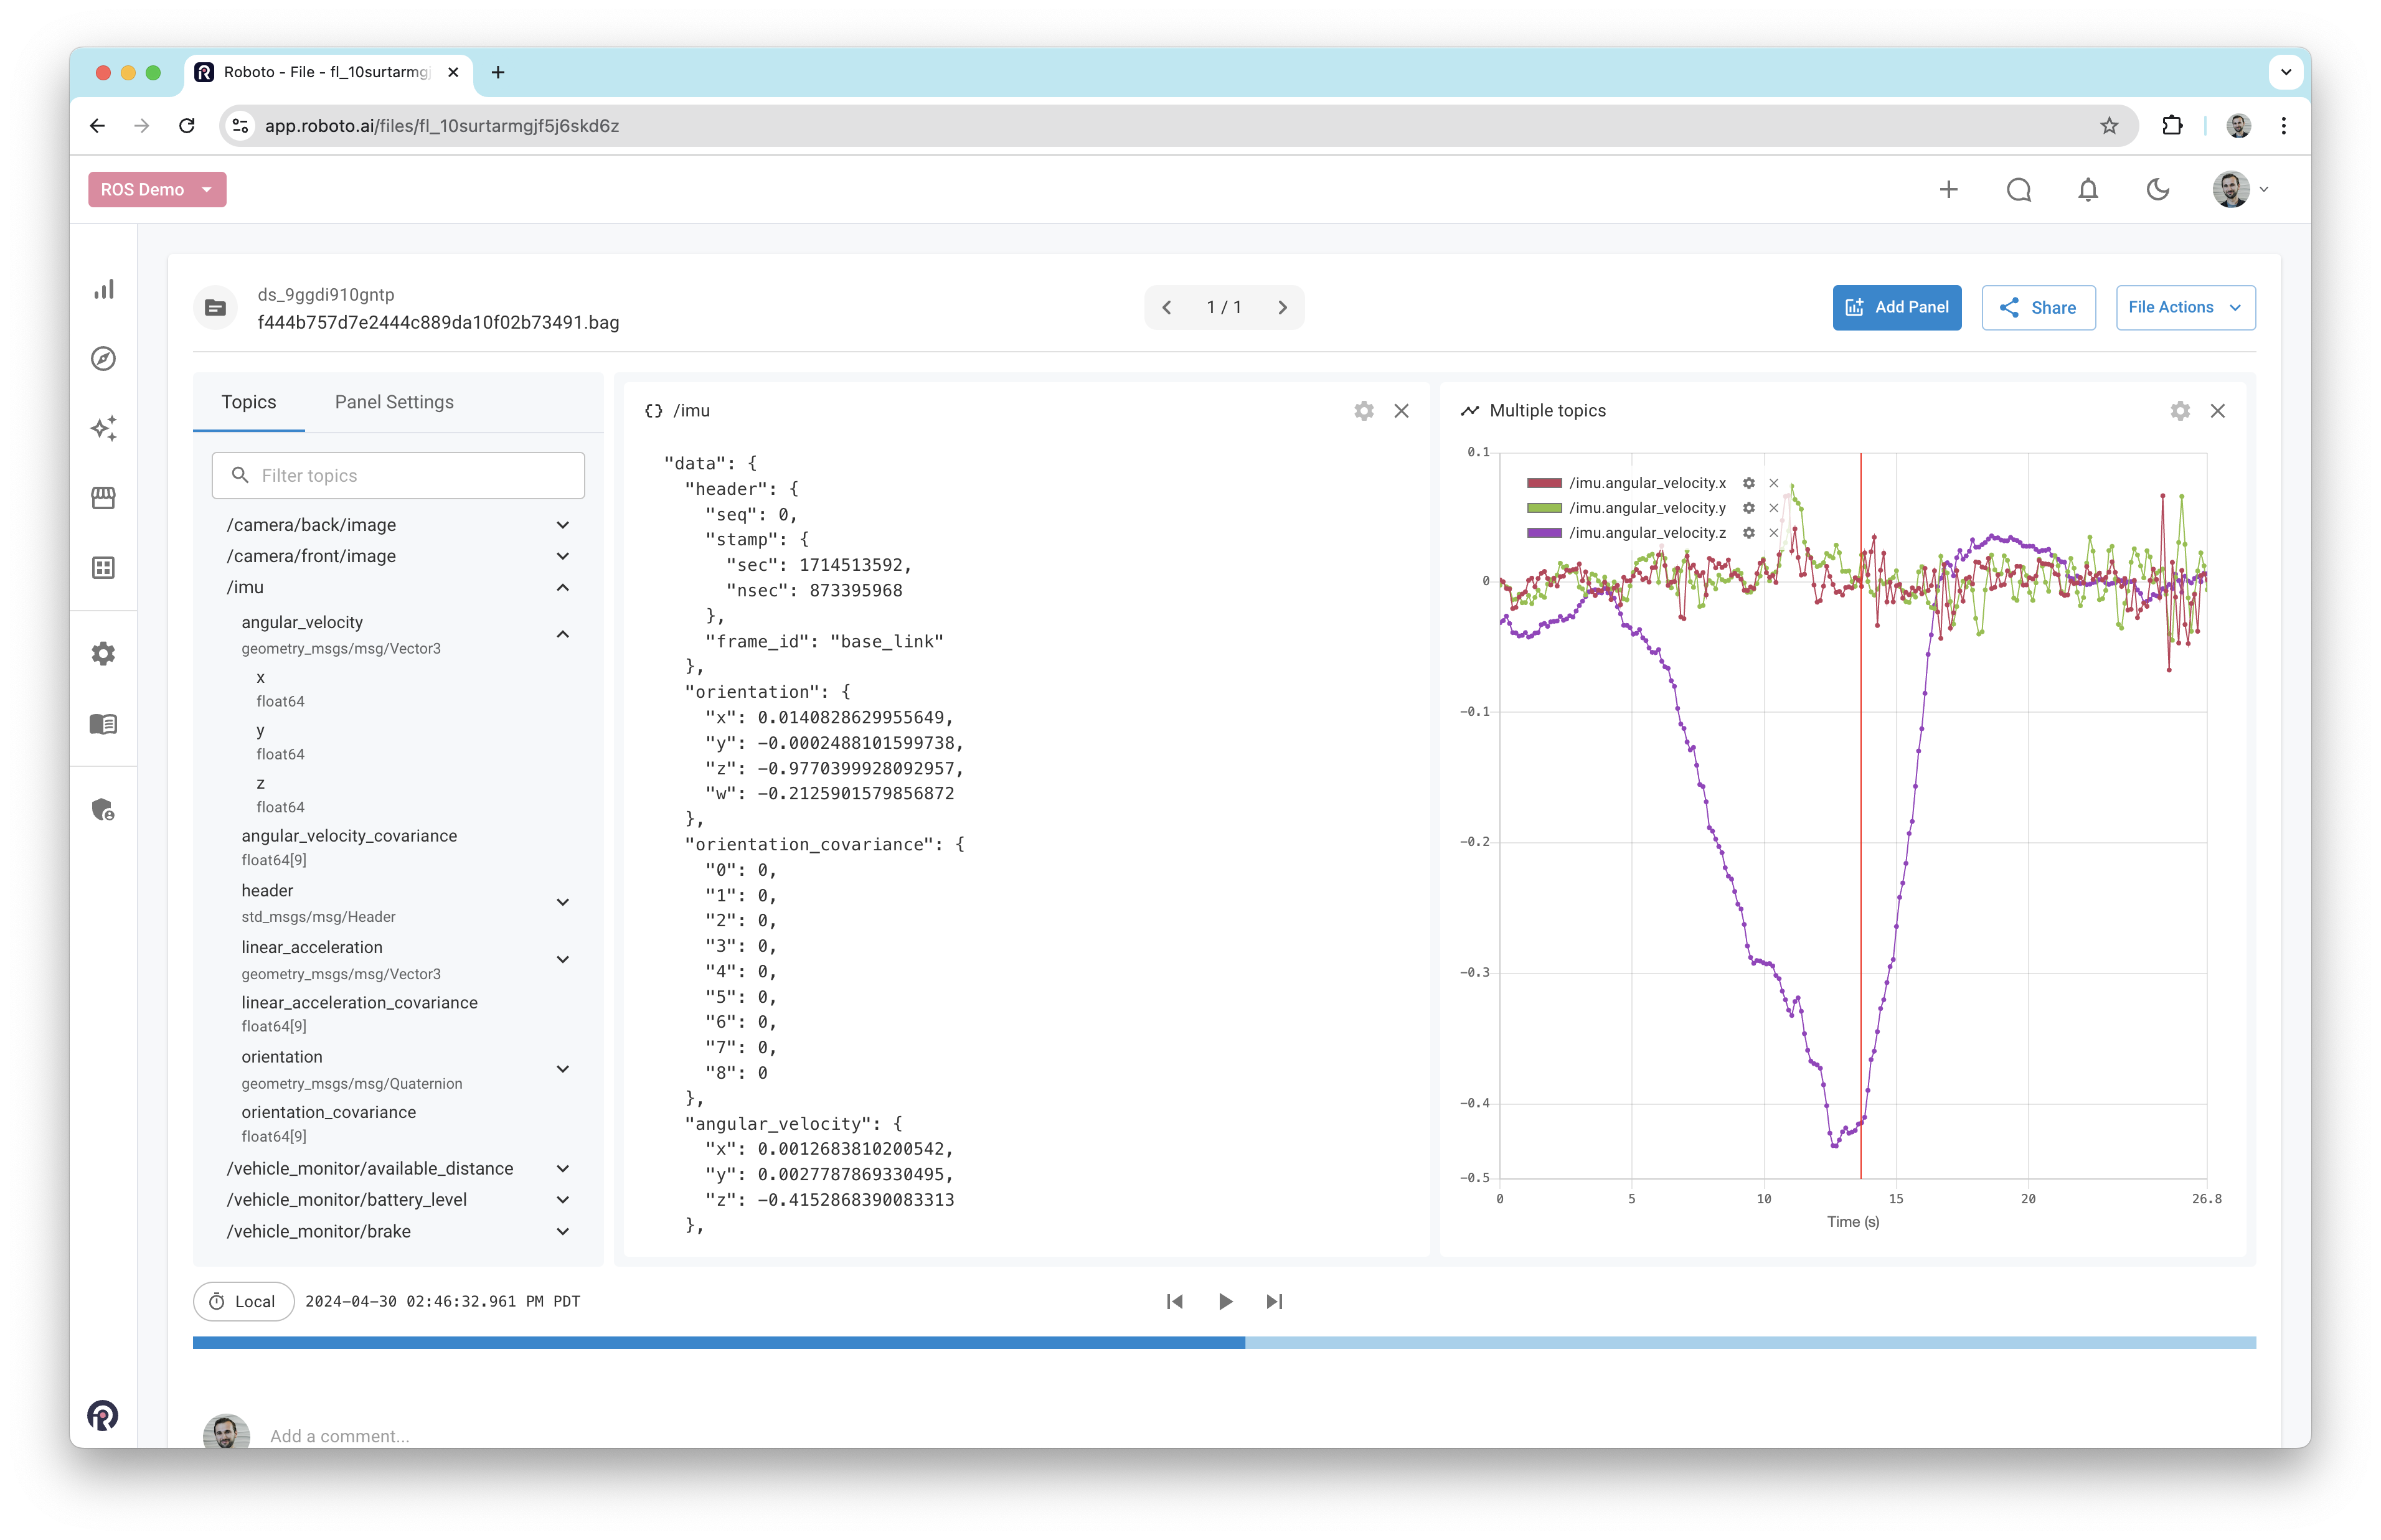
View raw messages#
To view raw messages, right-click on a field and select View in Raw panel. This will display the raw message data in its original form.
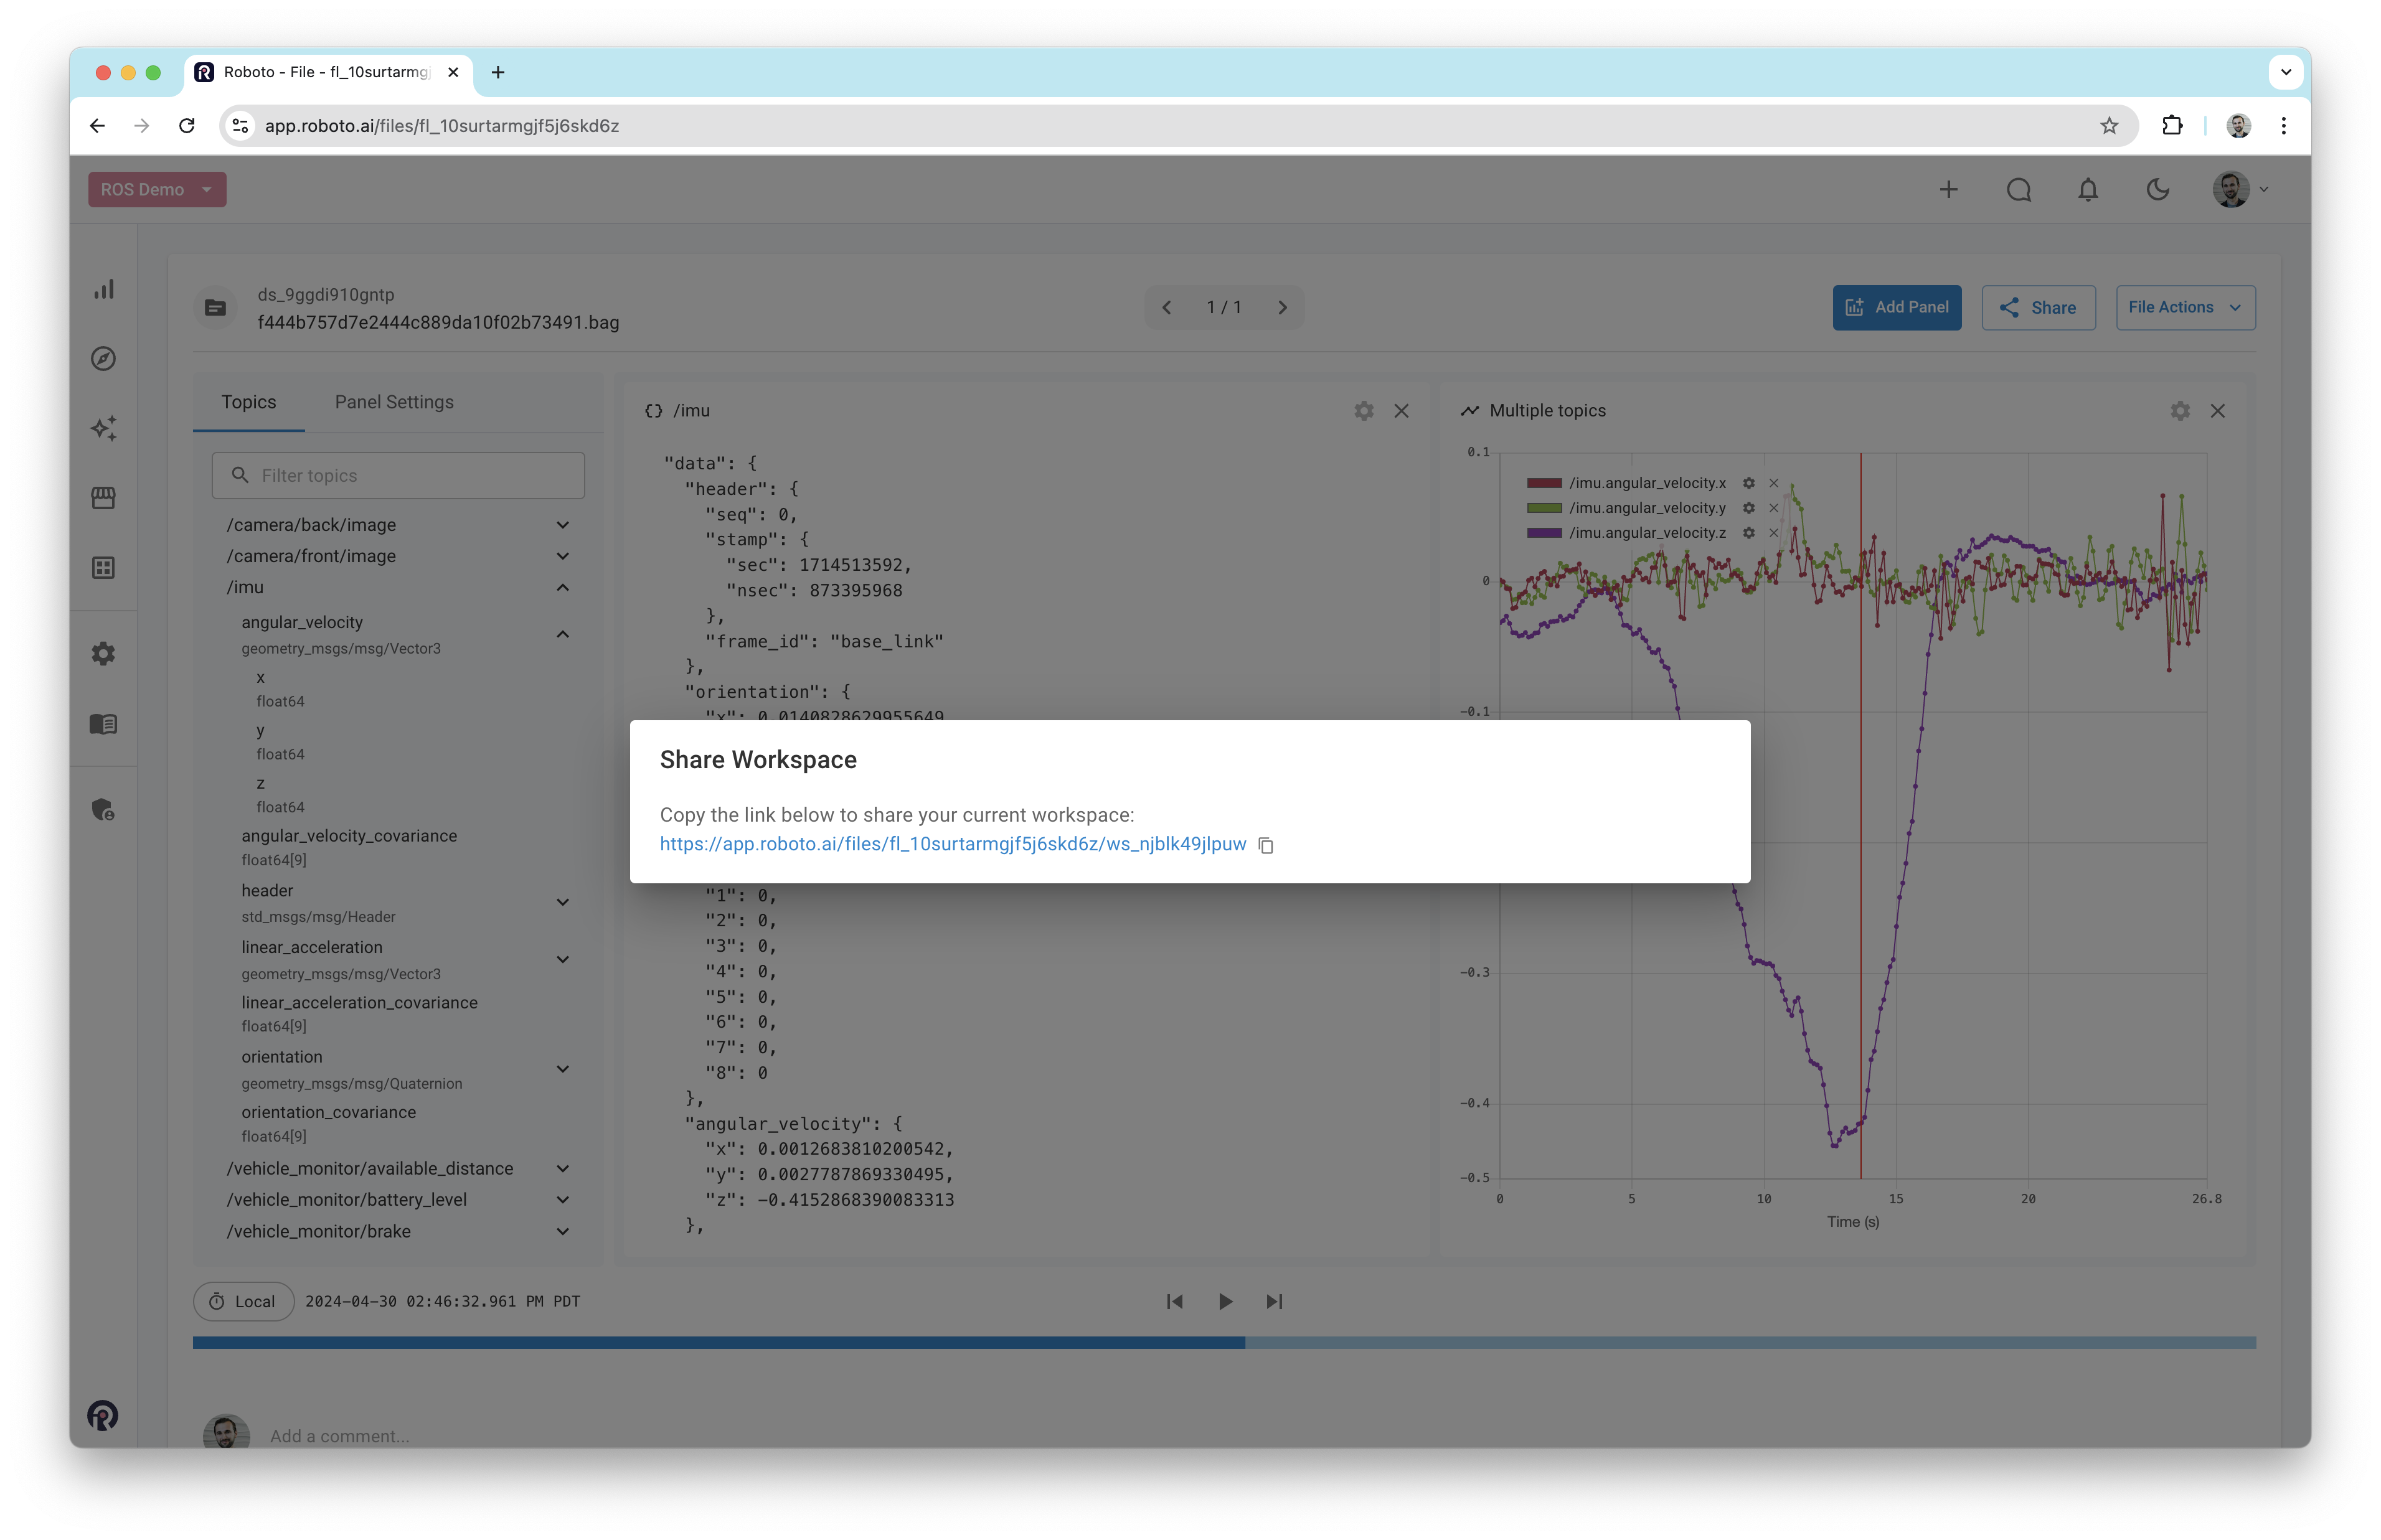
Share a workspace#
Roboto enables you to easily share workspaces with others. To do this, click on the Share button in the top right corner of the workspace. This will generate a URL that you can share with others. When they open the link, they will see the same collection of panels that you created.
Compare multiple logs#
Roboto enables you to compare several logs together in the visualizer.
Select multiple log files in a dataset’s file browser
If the logs you want to visualize together are in different datasets, you can add them to a collection first.
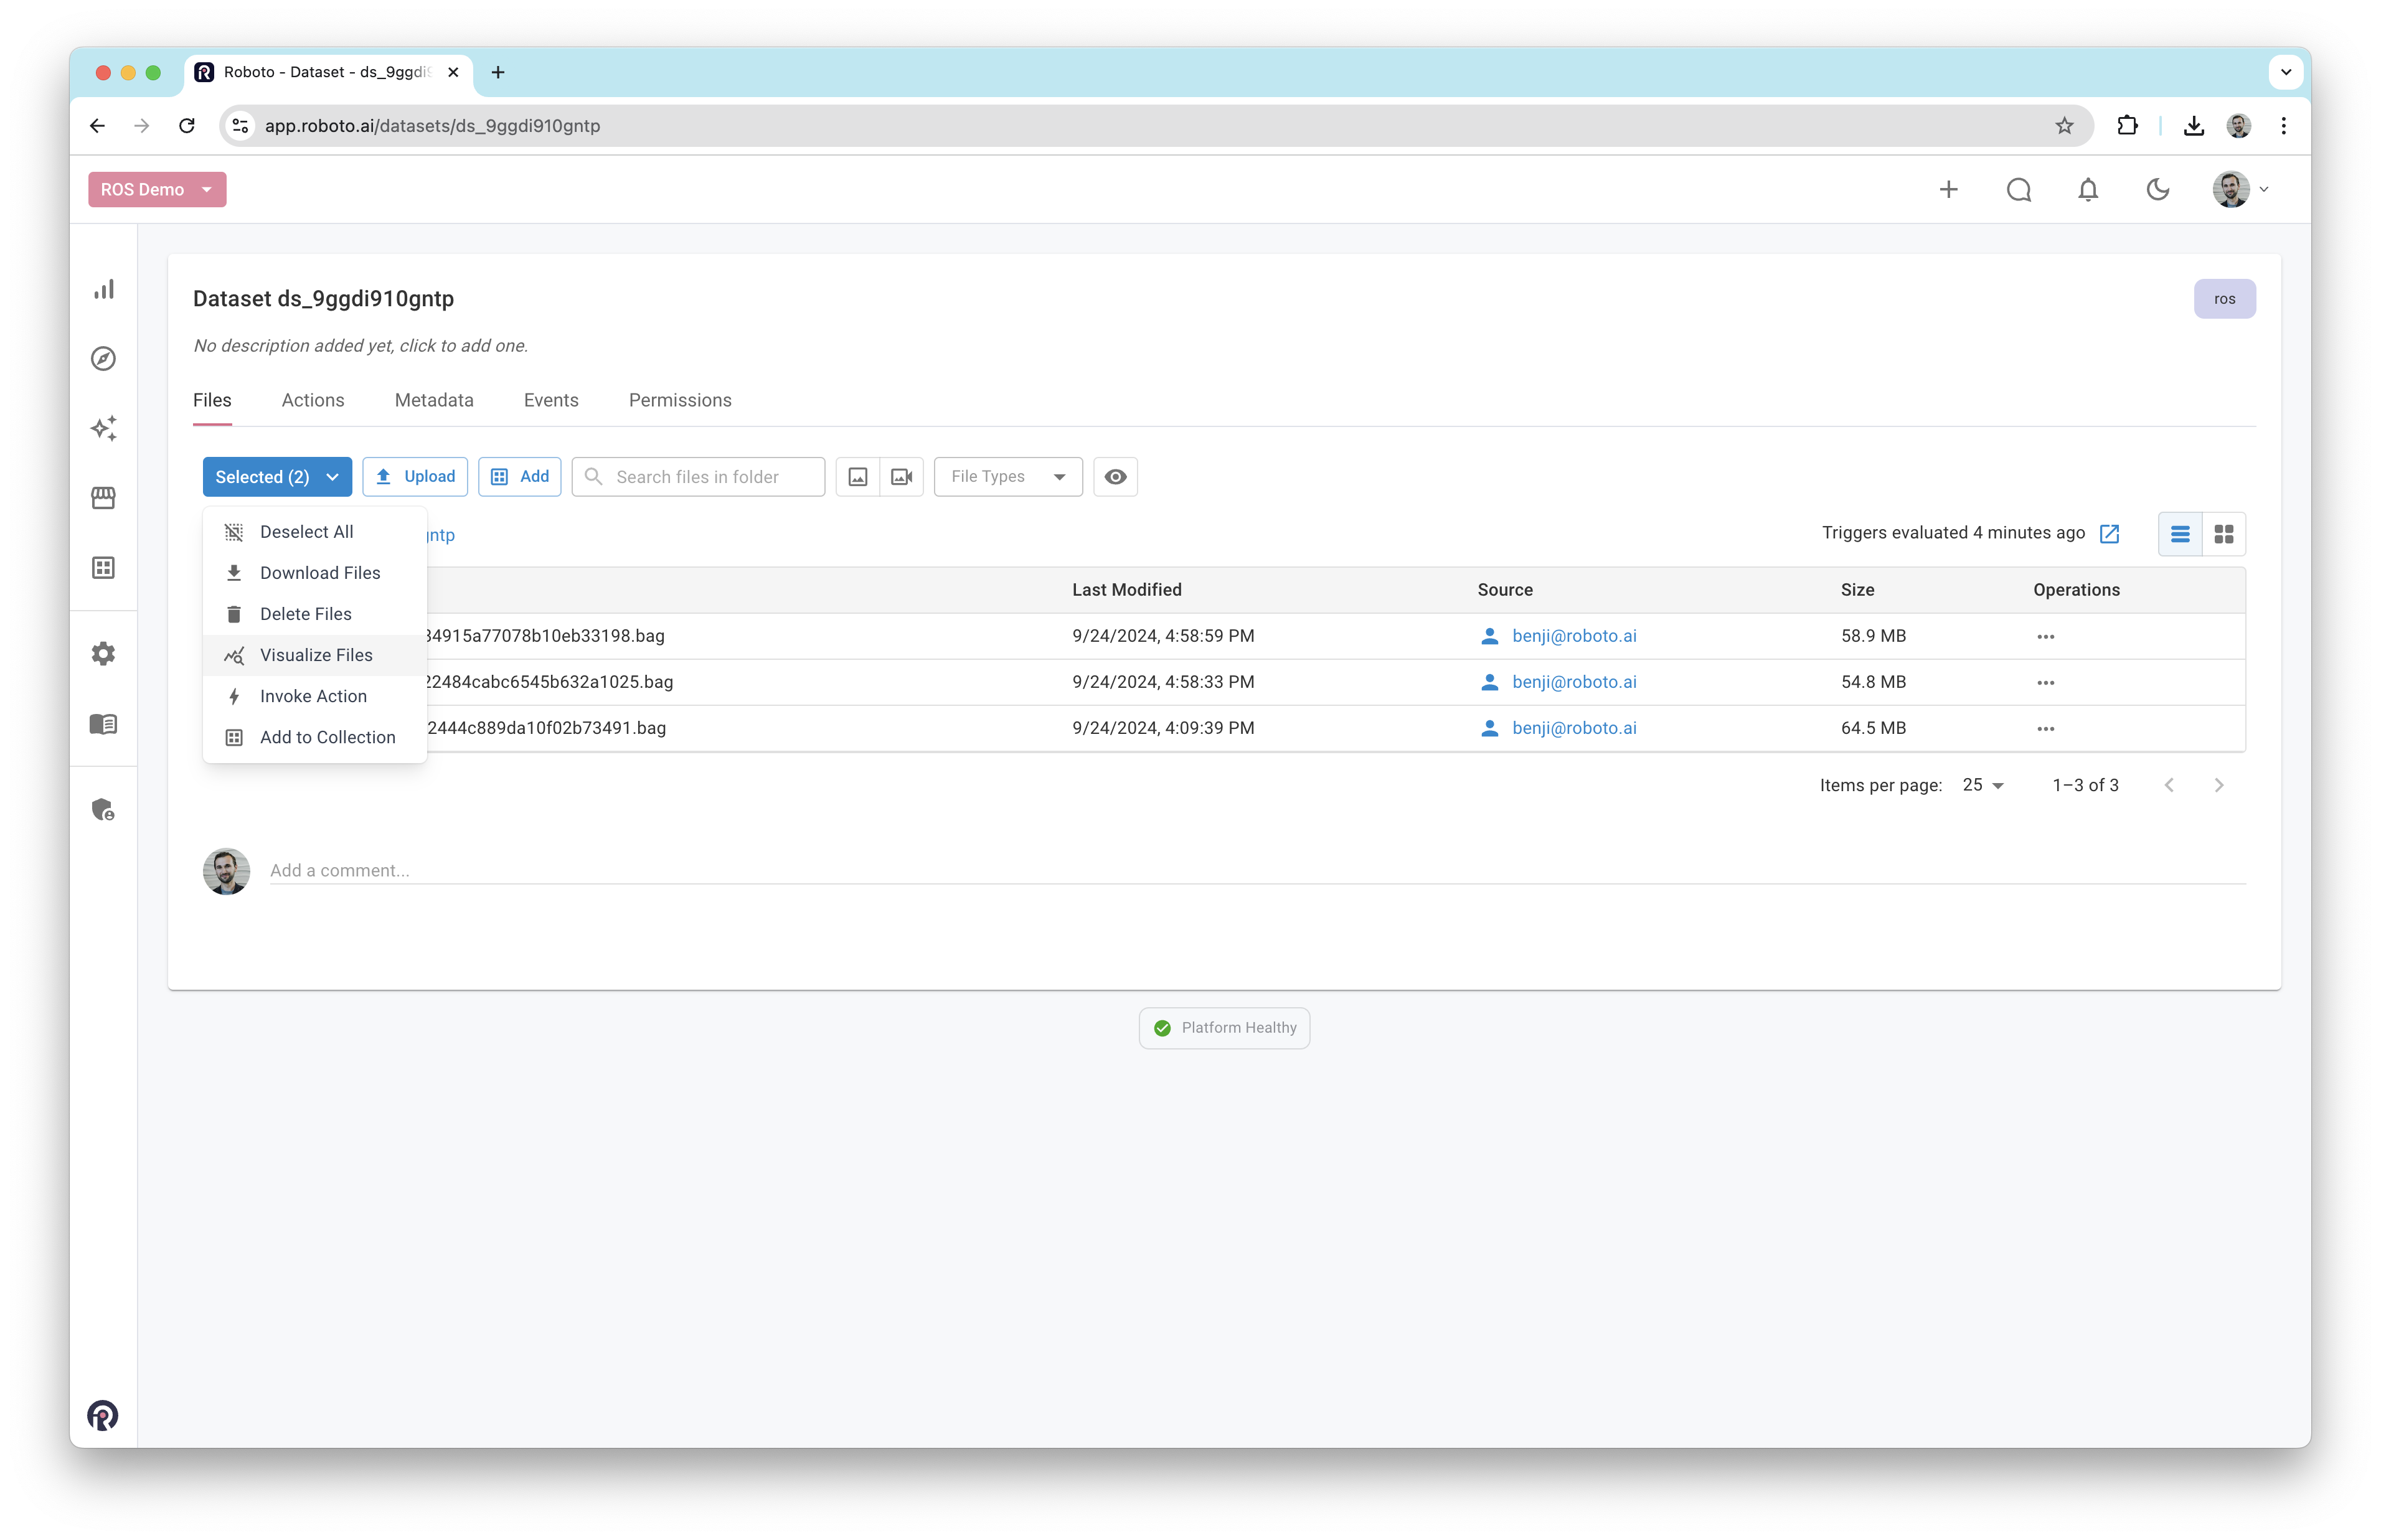
With the logs selected, click the
Selectedbutton that appears and then clickVisualize Files
You will be taken to the visualizer with both logs listed in the left sidebar. Clicking each log reveals its associated topics.
You can then visualize data from both logs in panels as before.

If your logs have GPS data, you can even compare paths by dragging a lat/lon topic from each log onto the Map panel.